| # | key | img1.webp | txt |
|---|
1
|
multicare_case_images__00000000
|
|
<|img1|>
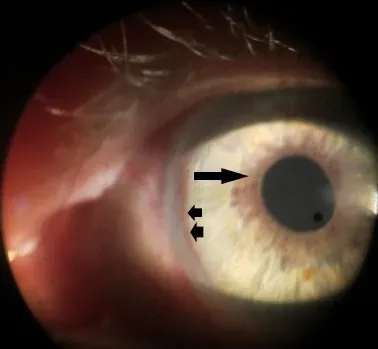
Slit lamp biomicroscopy of the anterior segment of the left eye shows marginal (arrow) and peripheral (arrowheads) circumferential neovascularization of the iris.
|
2
|
multicare_case_images__00000001
|
|
<|img1|>
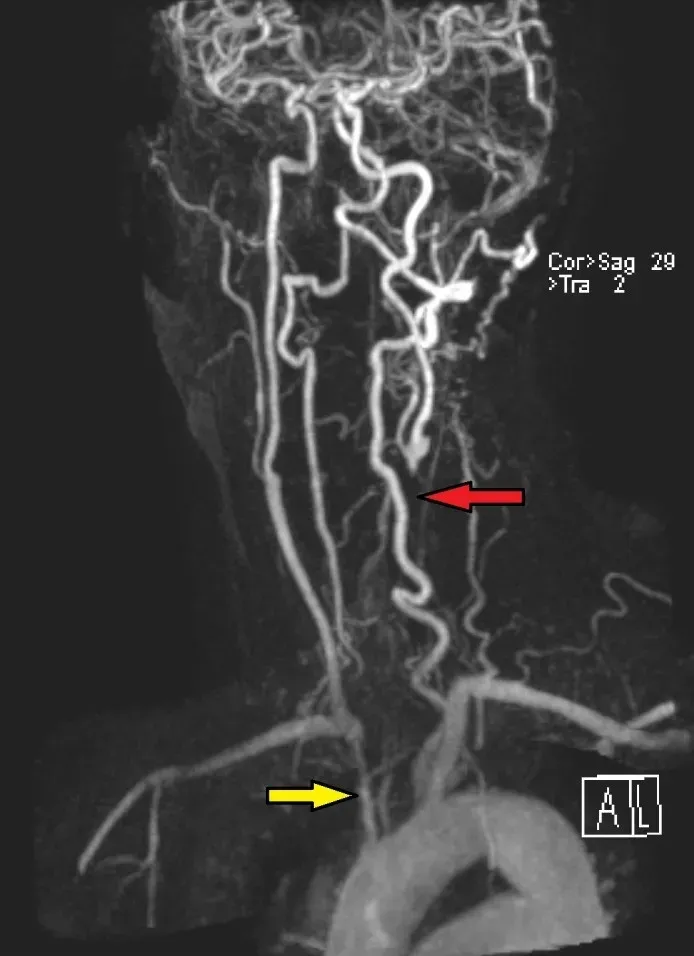
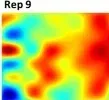
MRA extracranial showing severe narrowing of the origin of the right brachiocephalic artery (yellow arrow) and complete occlusion of the left common carotid artery with distal reconstitution of flow near the bifurcation (red arrow).
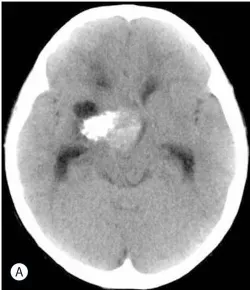
|
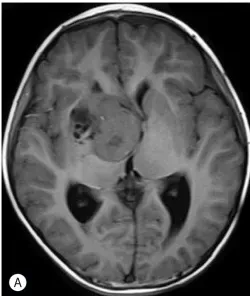
3
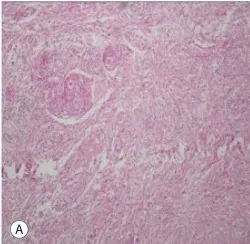
|
multicare_case_images__00000002
|
|
<|img1|>
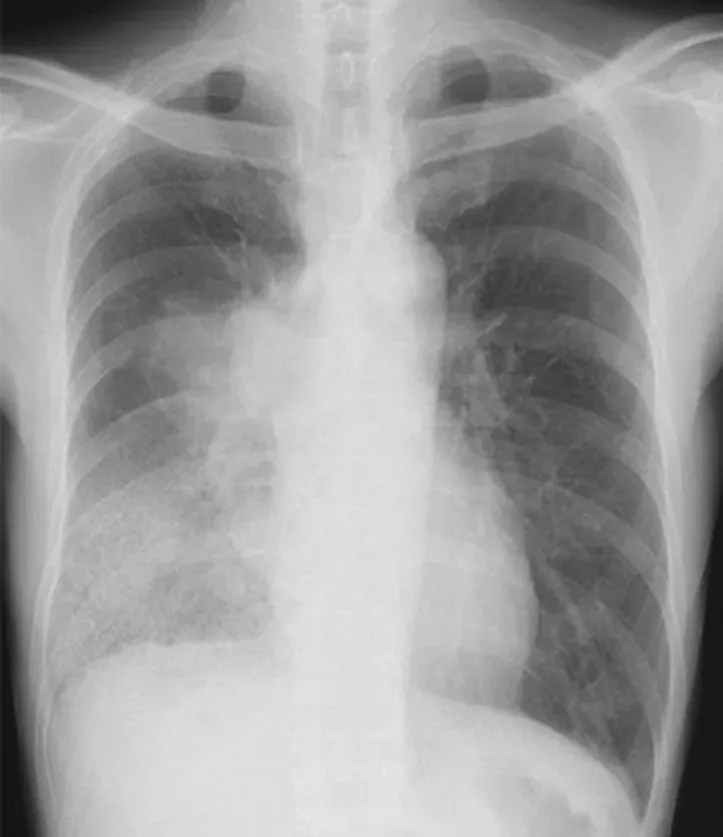
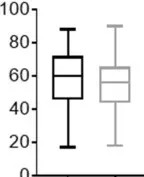
Chest X-ray and chest CT images before initial EGFR-TKI treatment. (a) Chest X-ray image showed a right hilar mass followed by lymphangitic carcinomatosis in the right lower lung field. (b) Chest CT image showed a large lung mass, extending to posterior chest wall and vertebral body, in the right lower lung as well as multiple lymphadenopathy and right pleural effusion.
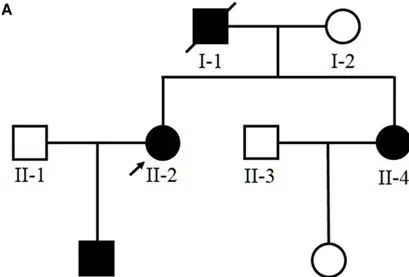
|
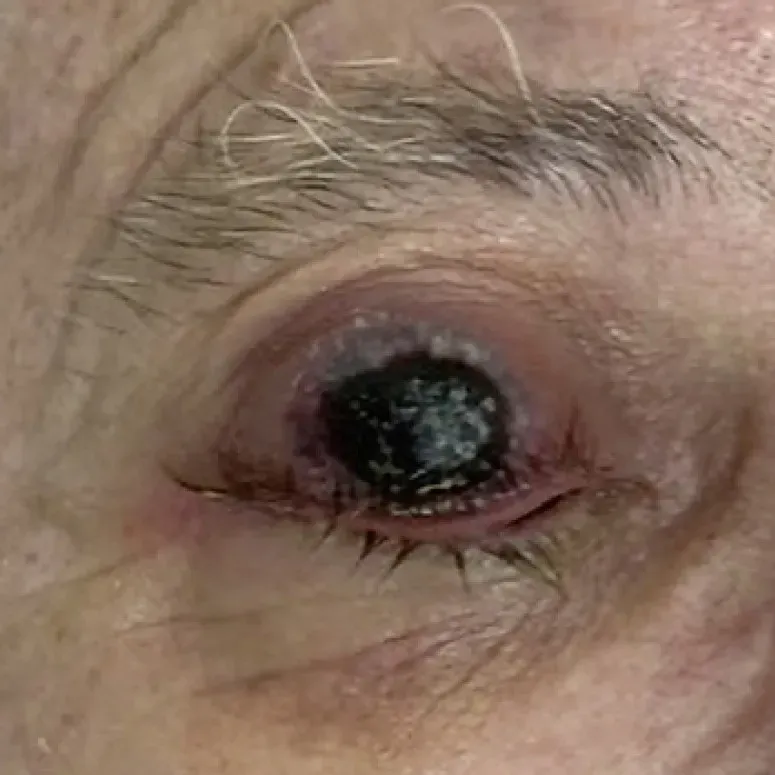
4
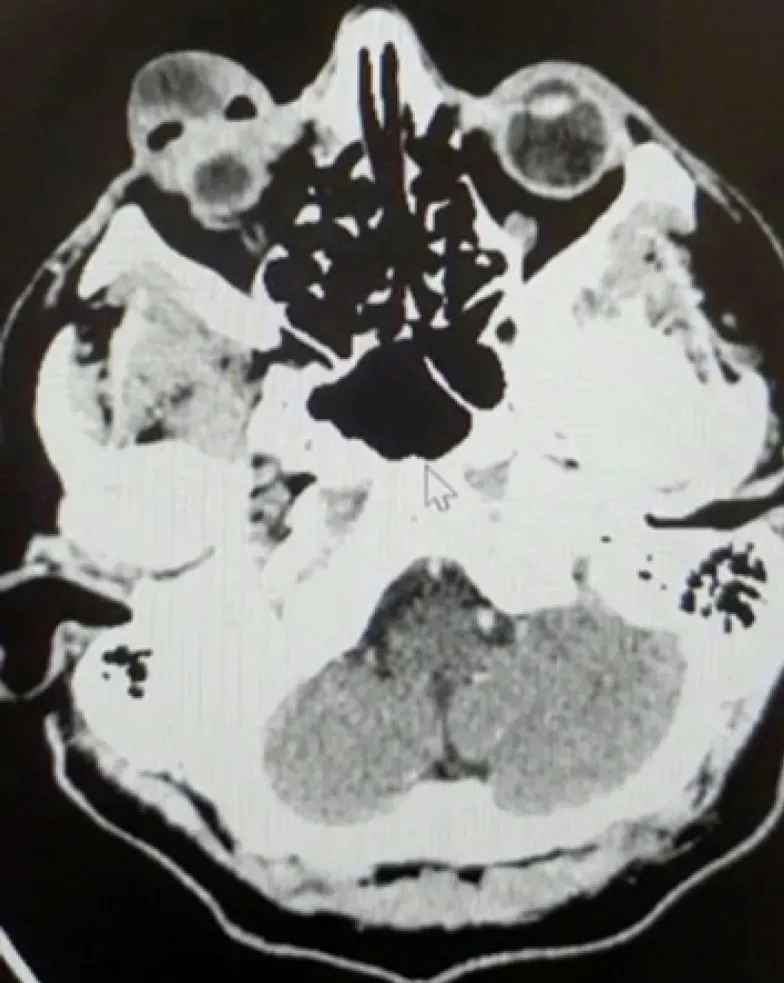
|
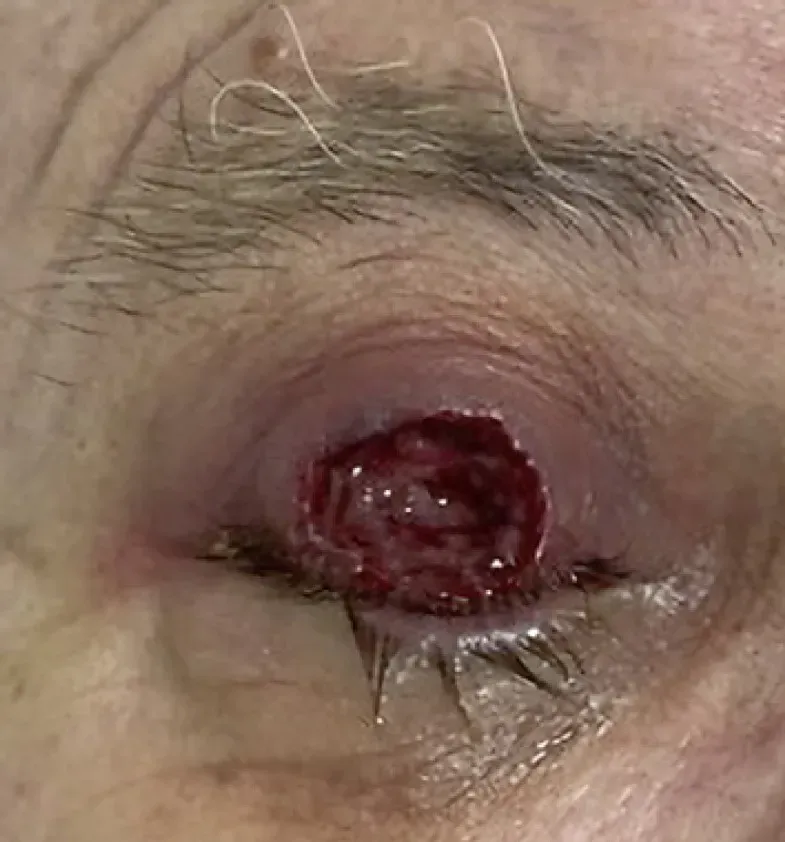
multicare_case_images__00000003
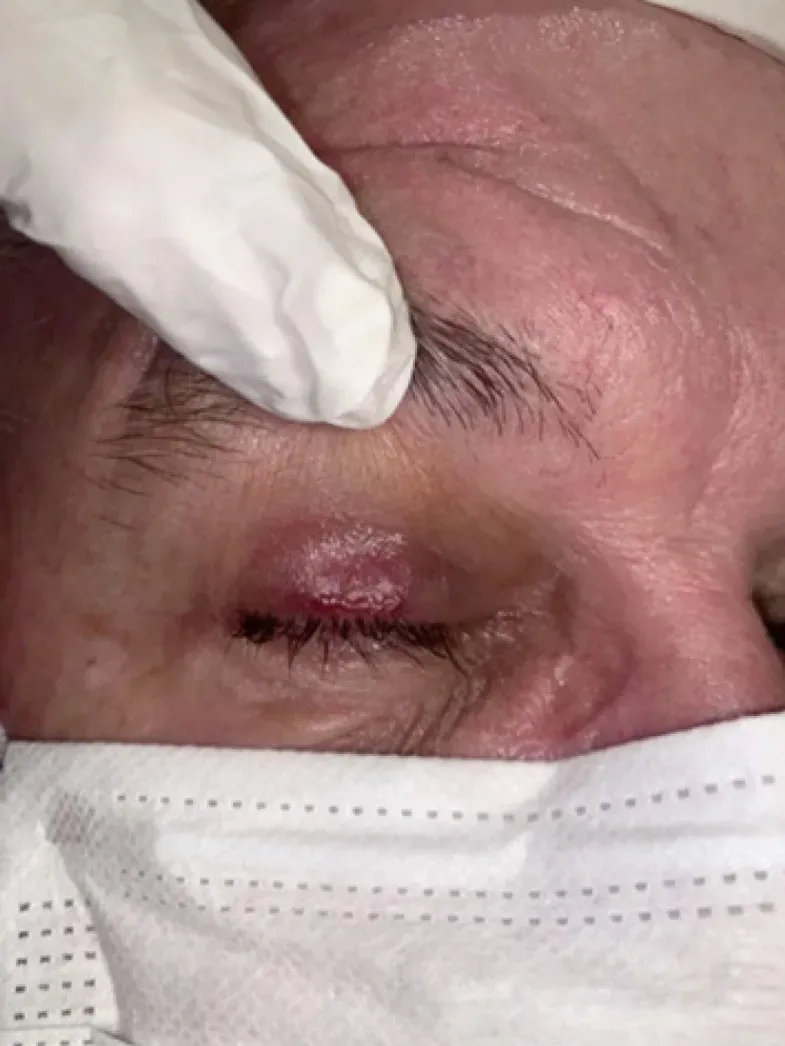
|
|
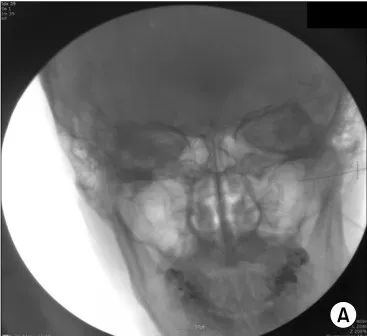
<|img1|>
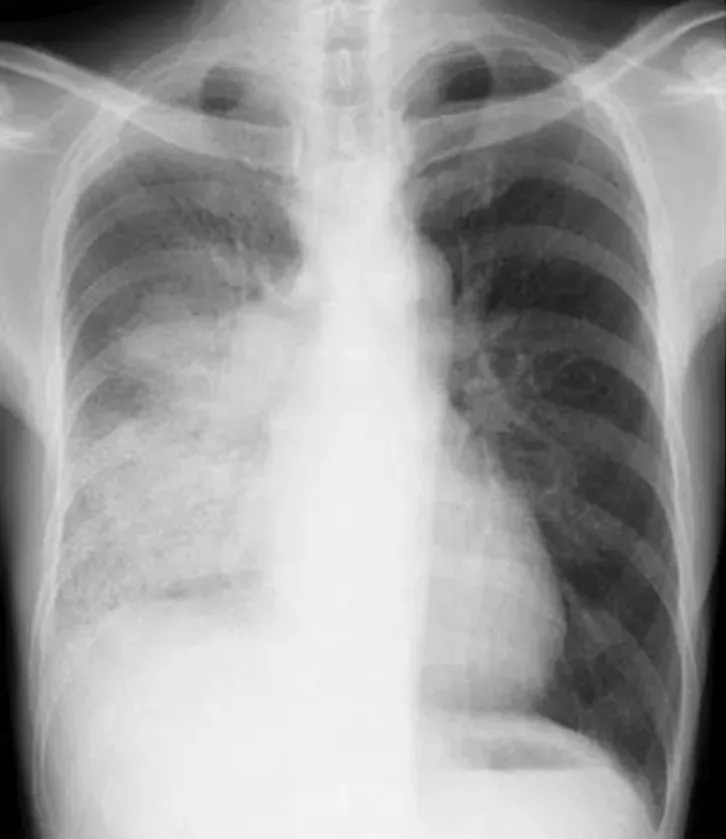
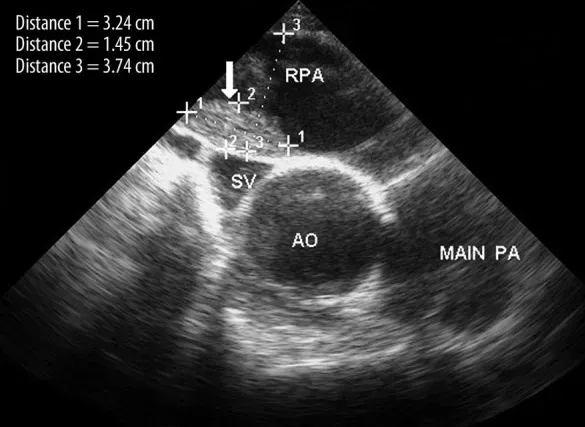
Chest X-ray and chest CT images after 28 days of gefitinib therapy. (a) Chest X-ray image showed the increased right hilar mass and the worsened lymphangitic carcinomatosis. (b) Chest CT image showed interval progression of the lung mass and the lymphadenopathy.
|
5
|
multicare_case_images__00000004
|
|
<|img1|>
Histopathological and immunohistochemical examination images for the surgical specimen. A-K, Specimen after the first surgery. A, H & E, x10. B, H & E, x20. C, AE-1/AE-3, x10. D, AS-1, x10. E, CD34, x10. F, CD68, x10. G, Desmin, x10. H, S-100 protein, x10. I, SMA, x10. J, SMA, x20. K, Vimentin, x10. L, Specimen after the third surgery, Ki-67 proliferation index 45%, x10. H & E = hematoxylin and eosin, SMA = smooth muscle actin.
|
6
|
multicare_case_images__00000005
|
|
<|img1|>
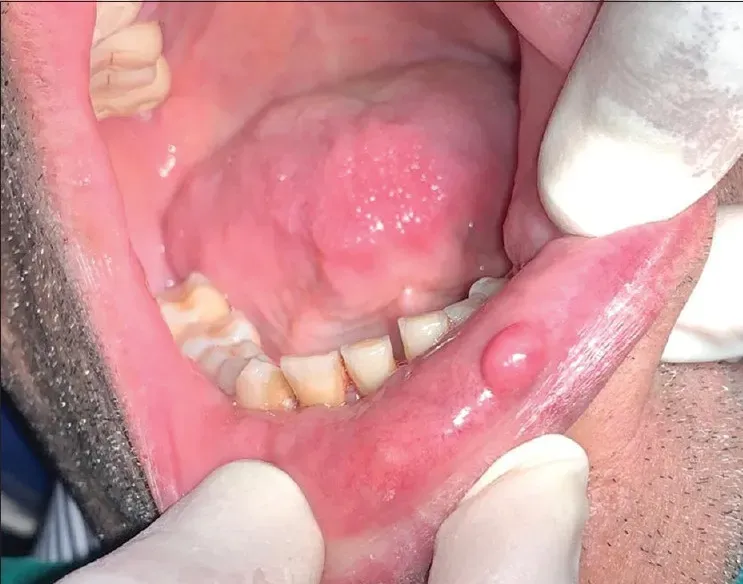
Clinical image shows a well-defined, roughly oval swelling on the lower lip
|
7
|
multicare_case_images__00000006
|
|
<|img1|>
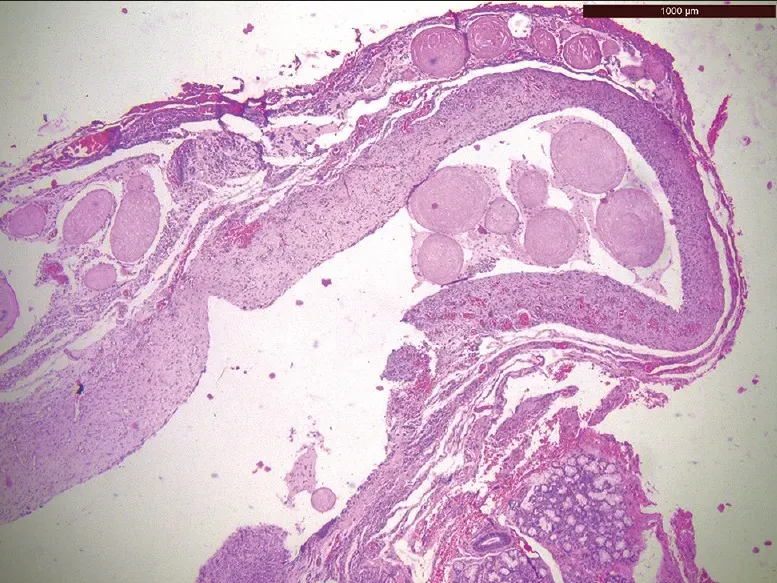
Histopathological image shows presence of large, eosinophilic globules having lamellated or whorled appearance (H&E stain, x4)
|
8
|
multicare_case_images__00000007
|
|
<|img1|>
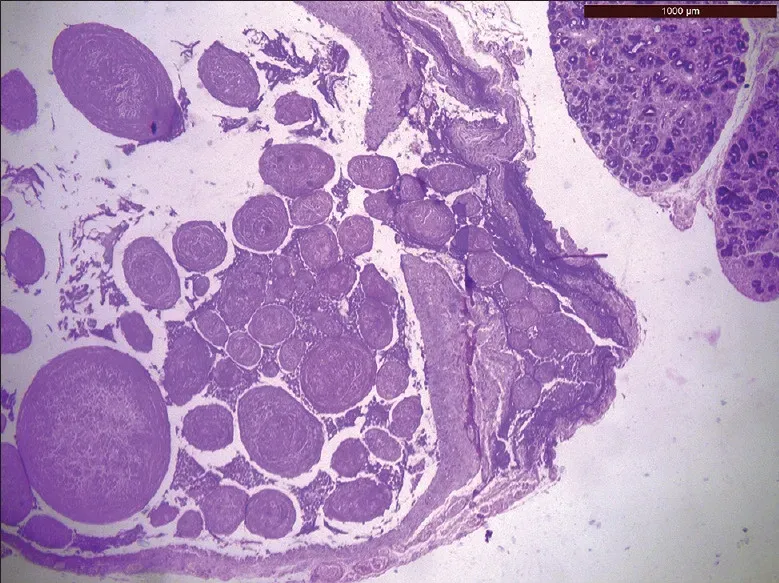
Histopathological image shows abundant mucin within the globules attached to the surrounding cystic capsule and few globules suspended freely within the lumen (PAS stain, x4)
|
9
|
multicare_case_images__00000008
|
|
<|img1|>
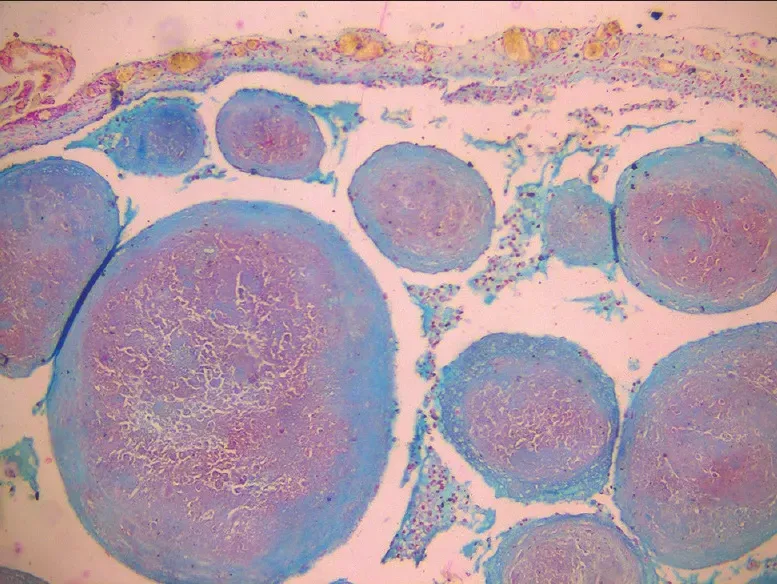
Histopathological image shows presence of mucin in the periphery with central cellular core (Alcian blue stain, x10)
|
10
|
multicare_case_images__00000009
|
|
<|img1|>
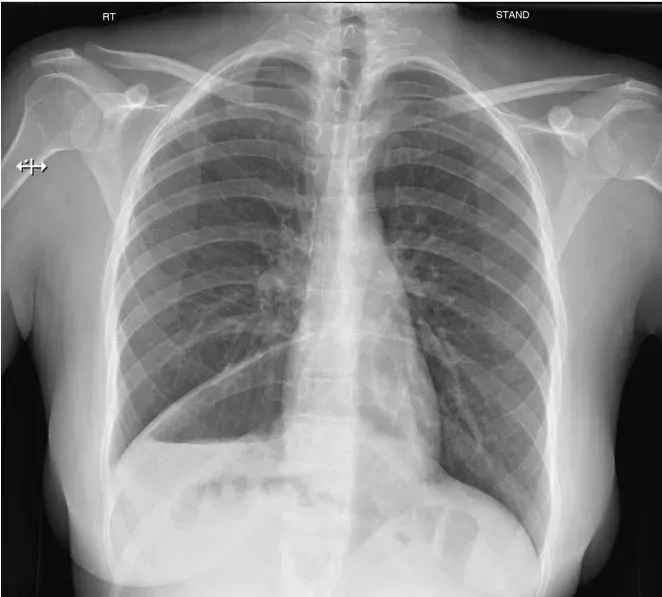
Pre-op x-ray chest with Chilaiditis Sign (a); Post-op x-ray chest (normal) (b).
|
11
|
multicare_case_images__00000010
|
|
<|img1|>
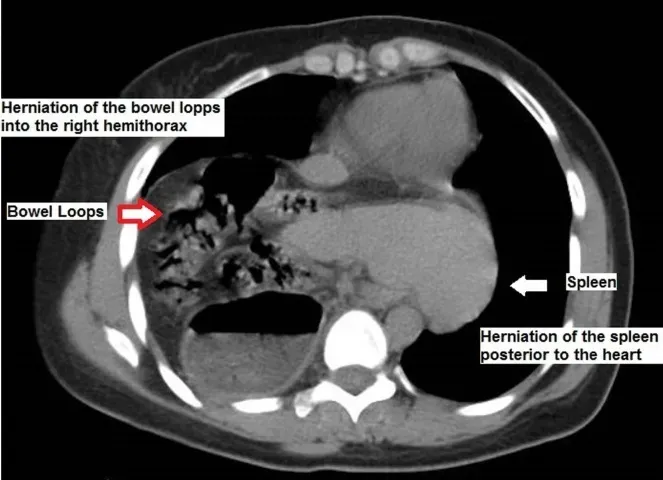
Non-contrast CT-Intrathorasic Extrusion of Spleen, Stomach and Bowels (a); Non-contrast CT-retrocardiac spleen (b).
|
12
|
multicare_case_images__00000011
|
|
<|img1|>
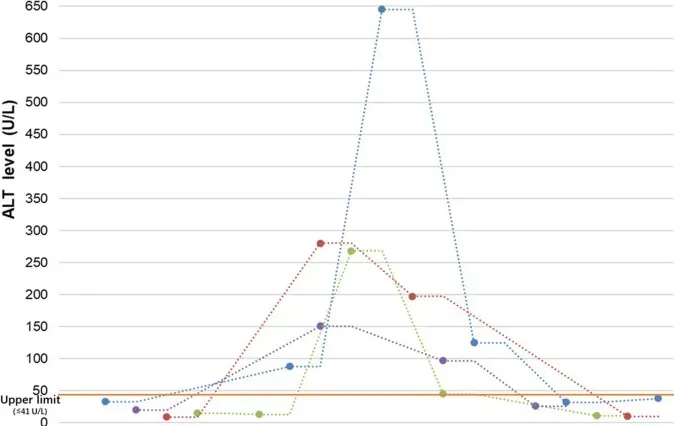
ALT level trend over time of the four patients. All patients had normal liver function at the initial stage of the course. ALT elevation (>41 U/L) occurred 5 to 8 days after the first onset of fever, then reached 3 to 10 folds of the upper range. All the patients received hepatoprotective therapy, and transaminase levels gradually decreased to the normal range after 2 to 3 weeks.
|
13
|
multicare_case_images__00000012
|
|
<|img1|>
ALT level trend over time of the four patients. All patients had normal liver function at the initial stage of the course. ALT elevation (>41 U/L) occurred 5 to 8 days after the first onset of fever, then reached 3 to 10 folds of the upper range. All the patients received hepatoprotective therapy, and transaminase levels gradually decreased to the normal range after 2 to 3 weeks.
|
14
|
multicare_case_images__00000013
|
|
<|img1|>
ALT level trend over time of the four patients. All patients had normal liver function at the initial stage of the course. ALT elevation (>41 U/L) occurred 5 to 8 days after the first onset of fever, then reached 3 to 10 folds of the upper range. All the patients received hepatoprotective therapy, and transaminase levels gradually decreased to the normal range after 2 to 3 weeks.
|
15
|
multicare_case_images__00000014
|
|
<|img1|>
ALT level trend over time of the four patients. All patients had normal liver function at the initial stage of the course. ALT elevation (>41 U/L) occurred 5 to 8 days after the first onset of fever, then reached 3 to 10 folds of the upper range. All the patients received hepatoprotective therapy, and transaminase levels gradually decreased to the normal range after 2 to 3 weeks.
|
16
|
multicare_case_images__00000015
|
|
<|img1|>
The 10 repetitions of third Duchenne muscular dystrophy (DMD) participant (DP3) for wrist extension that were used to acquire the average normalized map. The lower part shows an example of the protocol followed to record the data. In this example, the participant was instructed to extend his wrist for 3 s and then rest for 3 s. This was repeated 10 times. The same procedure was followed for all the seven gestures.
|
17
|
multicare_case_images__00000016
|
|
<|img1|>
CT revealing calcification, necrosis, cystic formation of the mass lesion (A and B). No hyperostosis or bone absorbtion was observed (C).
|
18
|
multicare_case_images__00000017
|
|
<|img1|>
MRI showing a mass lesion in the right basal ganglia consisted of solid and cystic parts. The solid part manifesting isointense signal on T1-weighted (A), T2-weighted (B), and FLAIR (C) with heterogeneous enhancement (D and E); the cystic part showing hypointense signal on both T1-weighted (A) and FLAIR (C) and hyperintensity on T2-weighted images (B) without enhancement of the wall (D and E). Although the lower margin of the tumor touched the dorsum sellae dura, 'dura tail' sign was not noted (E). Postoperative MRI revealing that most of the tumor has been resected and the residual part detached from the dorsum sellae (F). Subdural fluid accumulation in the surgical region was also detected (F). FLAIR: fluid at tenuation inversion recovery, MRI: magetic resonance imaging.
|
19
|
multicare_case_images__00000018
|
|
<|img1|>
Hematoxylin-eosin staining exhibiting sheetlike growth, foci of spontaneous, increased cellularity, small cells with a high nucleus-to-cytoplasm ratio and prominent nucleoli (A: original magnification, x100; B: original magnification, x400). Immunohistochemical staining showing positive for epitheliod membrane antigen (D: original magnification, x400), but negative for glial fibrillary acidic protein (E: original magnification, x400) and S-100 protein (F: original magnification, x400). Ki-67 labeling index being approximately 10% (C: original magnification, x400).
|
20
|
multicare_case_images__00000019
|
|
<|img1|>
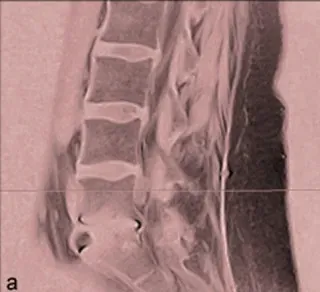
Preoperative T2-weighted magnetic resonance imaging in (a) sagittal and (b) axial views demonstrating the left-sided lateral recess epidural venous plexus at the adjacent level above a fusion mimicking a herniated disk associated with adjacent segment disease.
|
21
|
multicare_case_images__00000020
|
|
<|img1|>
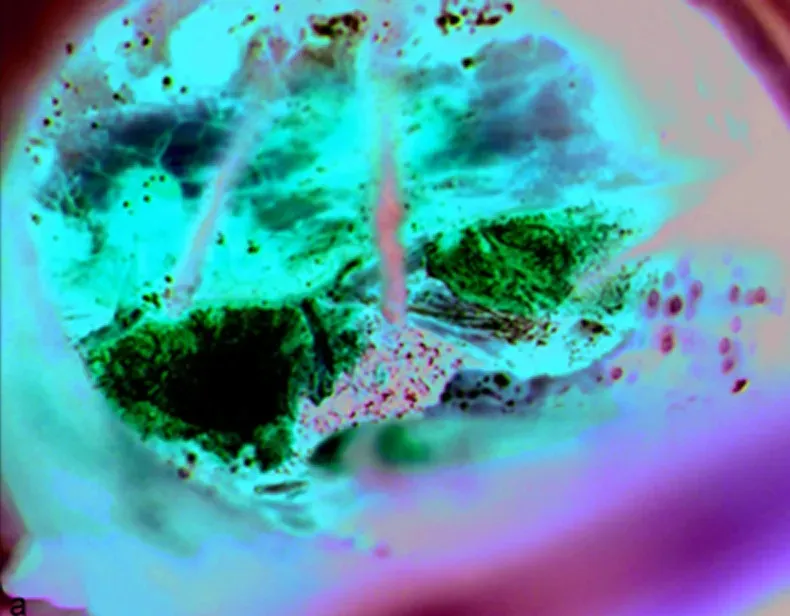
Intraoperative view down the minimally invasive tubular retractor showing (a) the lateral edge of the dural and nerve root with cottonoids and Surgicel  hemostatic material at both the nerve root shoulder and axilla after encountering copious venous bleeding. (b) View of the nerve root after exploration which demonstrated no herniated disk bulge or fragment.
|
22
|
multicare_case_images__00000021
|
|
<|img1|>
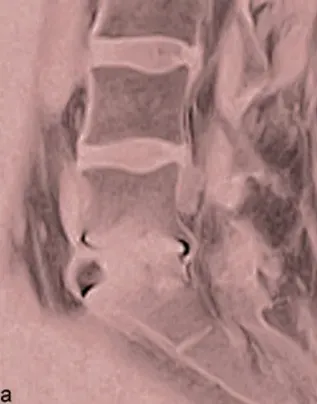
(a) Preoperative and (b) postoperative T2-weighted magnetic resonance imaging showing resolution of the epidural venous plexus after surgical intervention, confirming its etiology as the source of radiculopathy.
|
23
|
multicare_case_images__00000022
|
|
<|img1|>
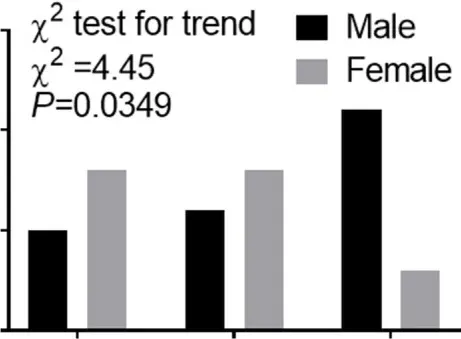
Trend data of clinical classification of severity in a Case series of COVID-19. Numbers of cases of men or women in different clinical classes of severity. Chi-square (chi2) test for trend indicated that males tend to experience more serious cases of COVID-19 than females according to the clinical classification of severity including Mild+Moderate, Severe, and Critical.
|
24
|
multicare_case_images__00000023
|
|
<|img1|>
Role of age and gender in morbidity and mortality in a Cases series of SARS, in 2003. (A) The whole spectrum of age in patients who died from and survived SARS. (B) Comparation of age between males and females in both patients who died from and survived SARS. (C) Gender distribution in both patients who died from and survived SARS. (D) Survival analysis comparing mortality rates between male and female patients with SARS.
|
25
|
multicare_case_images__00000024
|
|
<|img1|>
The clinical and genetic information of the family. (A) Pedigree of the family with low levels of HDL-c. Family members are identified by generations and numbers. Squares indicate male family members; circles, female members; closed symbols, affected members; open symbols, unaffected members; arrow, proband. (B) The coronary angiography of the proband, the arrow shows the stenosis of the anterior descending coronary artery. The ECG testing of the proband before percutaneous coronary intervention (C) and after percutaneous coronary intervention (D). (E) Sequencing results of the ABCA8 mutation. Sequence chromatogram indicates a C to T transition of nucleotide 3460. (F) The structure of ABCA8 and the summary of reported mutations of ABCA8.
|
26
|
multicare_case_images__00000025
|
|
<|img1|>
Patient showing NF with eschar formation in upper eyelid in the right eye at the day of admission at the hospital. NF, necrotizing fasciitis.
|
27
|
multicare_case_images__00000026
|
|
<|img1|>
Tomography presenting preseptal edema and heterogeneous fluid, suggesting abscess in the right eyelid.
|
28
|
multicare_case_images__00000027
|
|
<|img1|>
Patient presenting the upper eyelid aspect of the right eye minutes after the debridement.
|
29
|
multicare_case_images__00000028
|
|
<|img1|>
Upper eyelid aspect after 15 days of the debridement.
|
30
|
multicare_case_images__00000029
|

|
<|img1|>
Upper eyelid aspect after 2 months of debridement with closed (a) and opened (b) eyes.
|
31
|
multicare_case_images__00000030
|
|
<|img1|>
Final position of the local anesthetic block needle under fluoroscopic guidance. The needle was positioned around the stylomastoid foramen. (A) Anteroposterior view. (B) Lateral view.
|
32
|
multicare_case_images__00000031
|
|
<|img1|>
A clot in the right pulmonary artery diagnosed by transesophageal echocardiography. AO - aorta, MPA - main pulmonary artery, RPA - right pulmonary artery.
|