| # | key | img1.png | txt |
|---|
1
|
medicat__00000000
|
|
<|img1|>
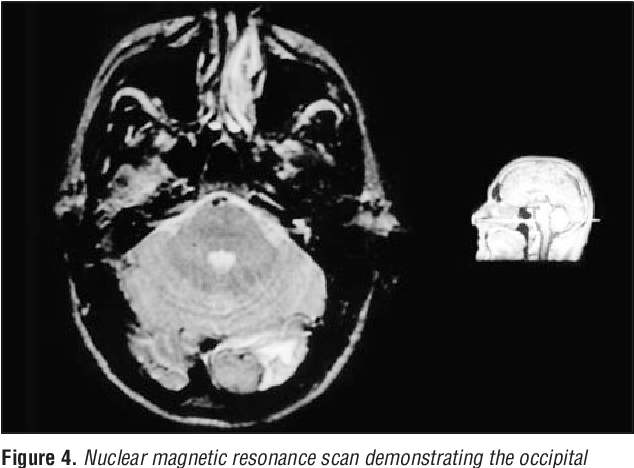
Figure 4. Nuclear magnetic resonance scan demonstrating the occipital lesion with irregular borders surrounded by slight edema.
|
2
|
medicat__00000001
|
|
<|img1|>
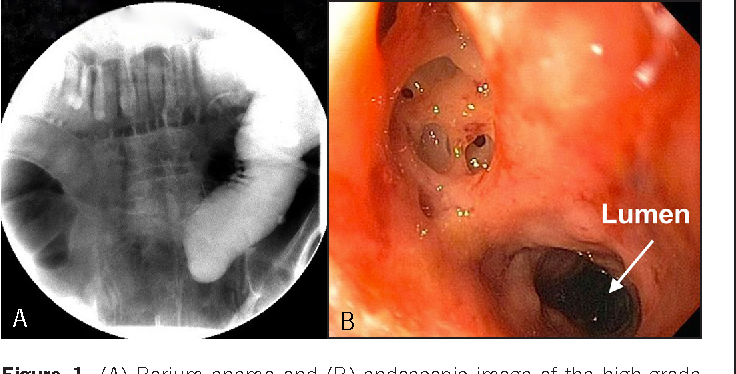
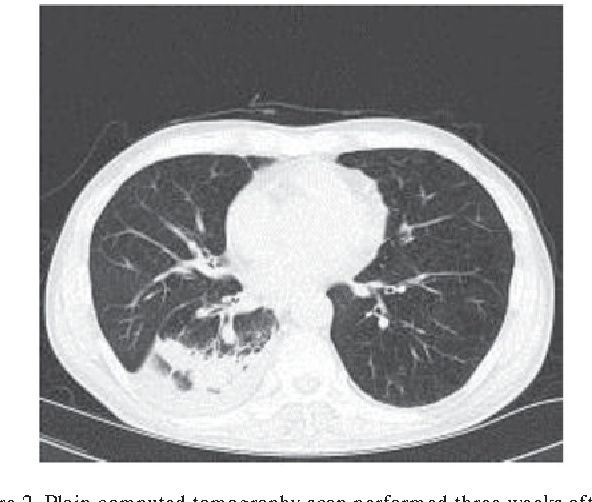
Figure 1. (A) Barium enema and (B) endoscopic image of the high-grade distal colonic obstruction caused by a 5-cm anastomotic stricture.
|
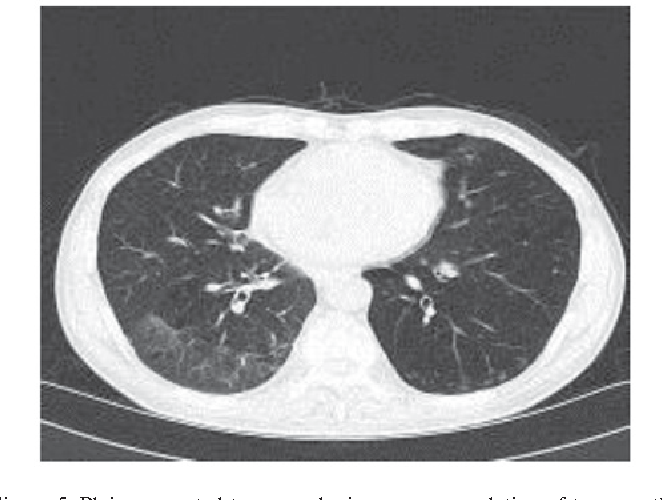
3
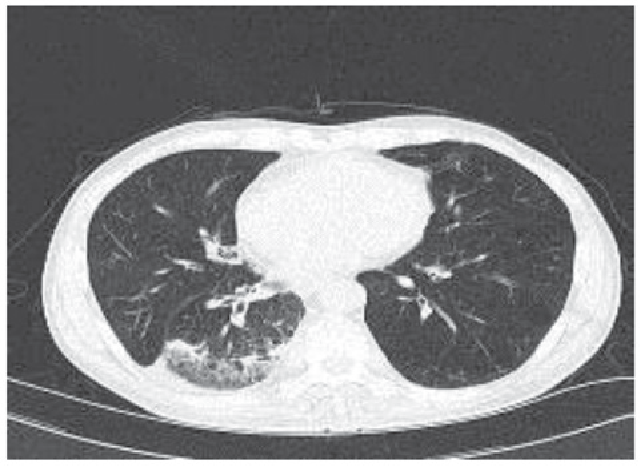
|
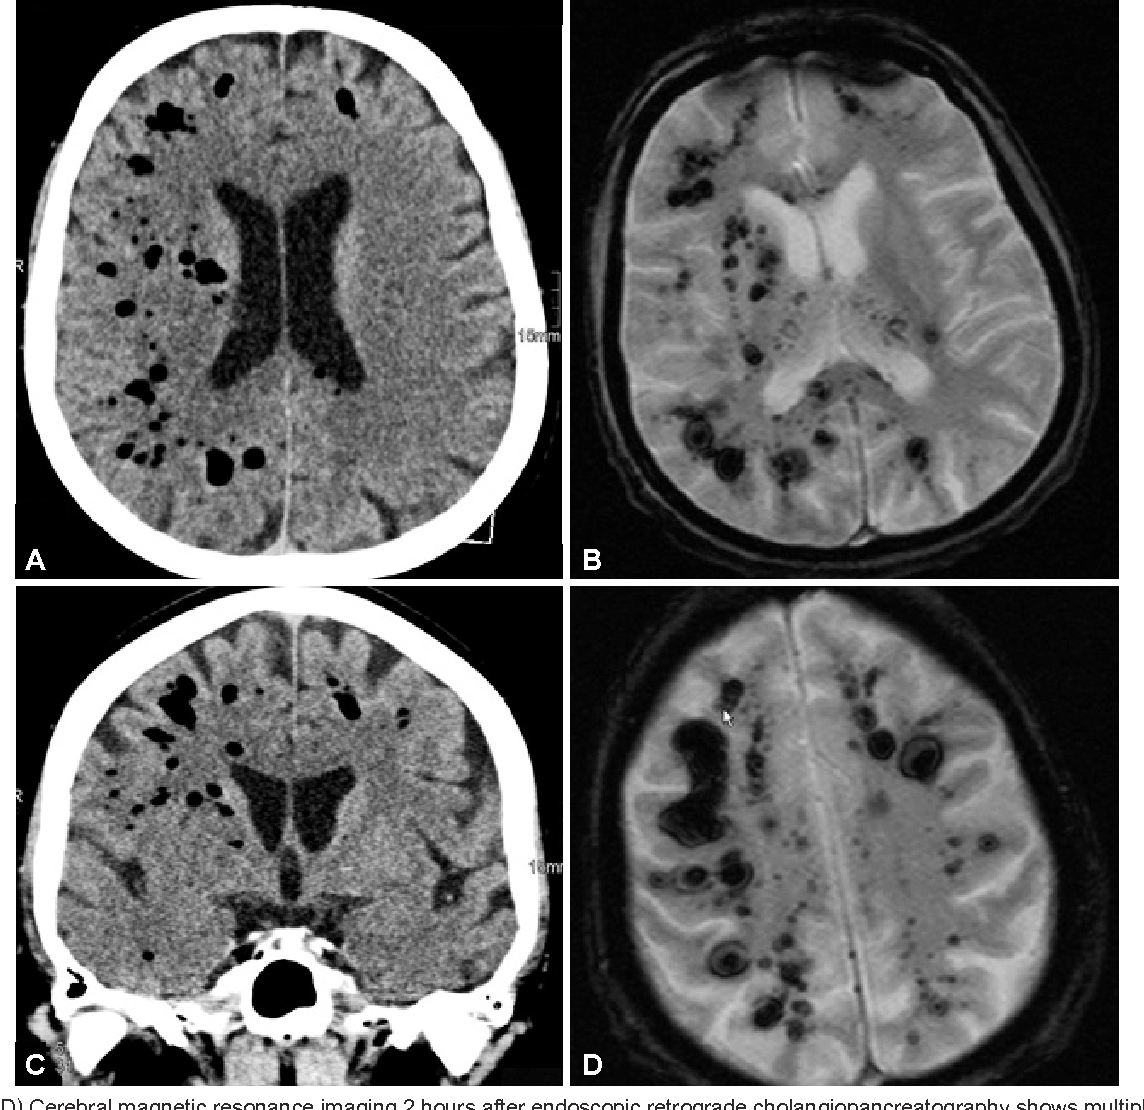
medicat__00000002
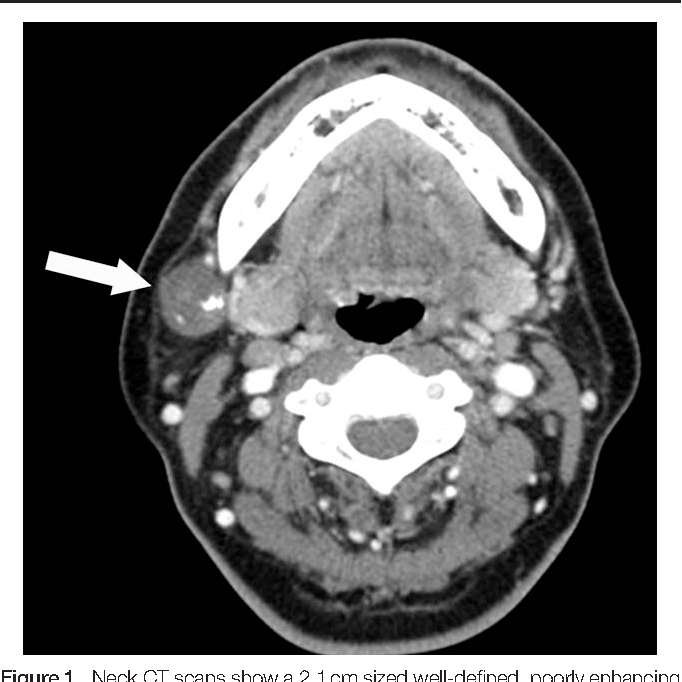
|
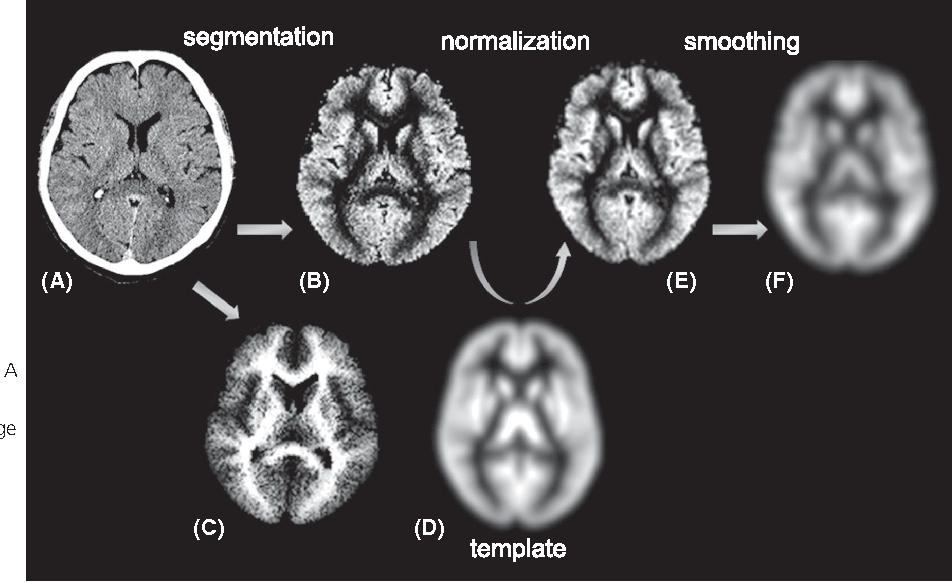
|
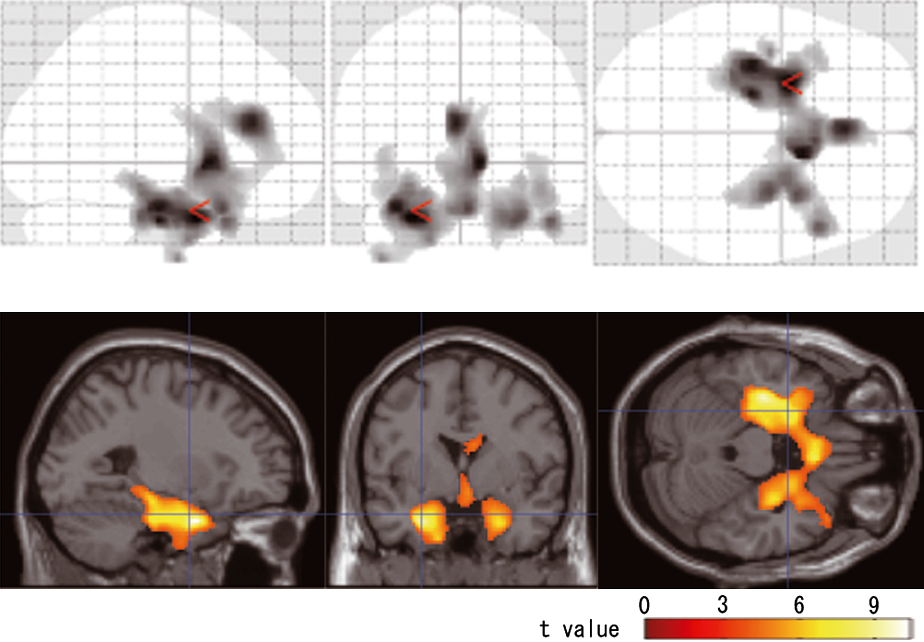
<|img1|>
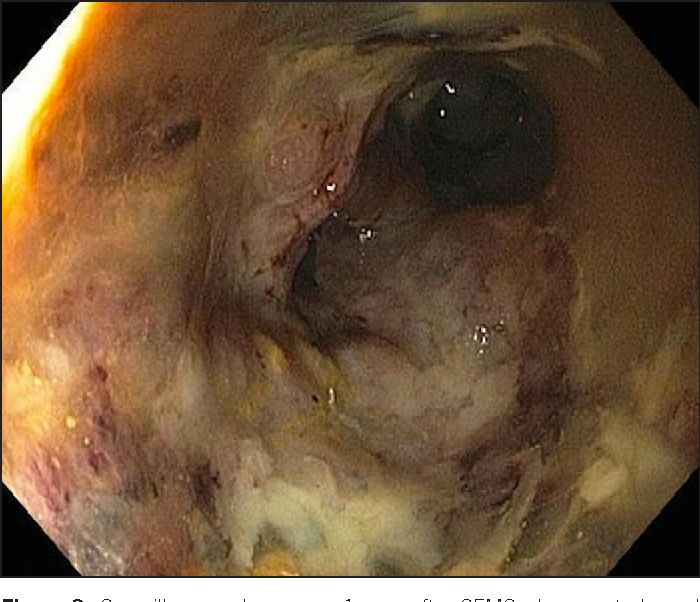
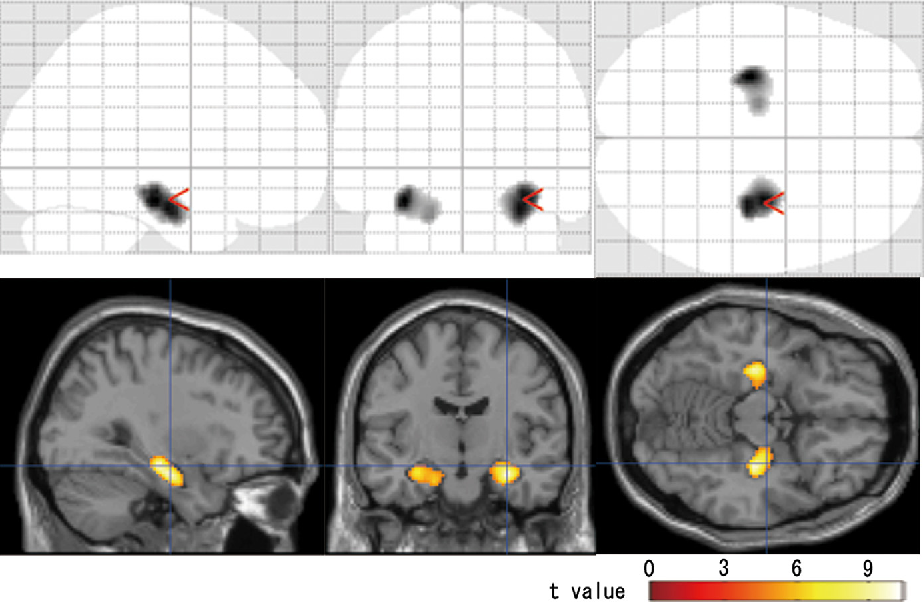
Figure 3. Surveillance colonoscopy 1 year after SEMS placement showed patent stents in the rectum with complete tissue ingrowth that appeared friable and inflammatory in nature.
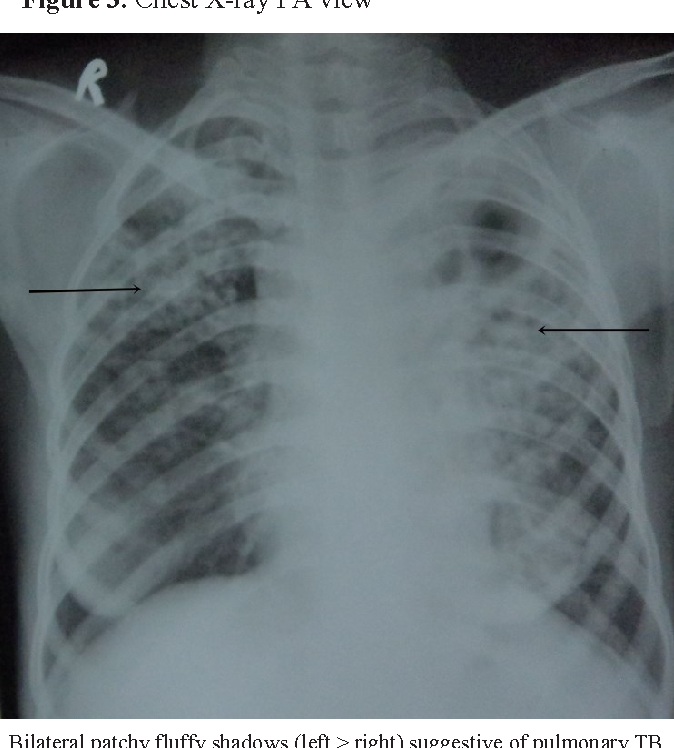
|
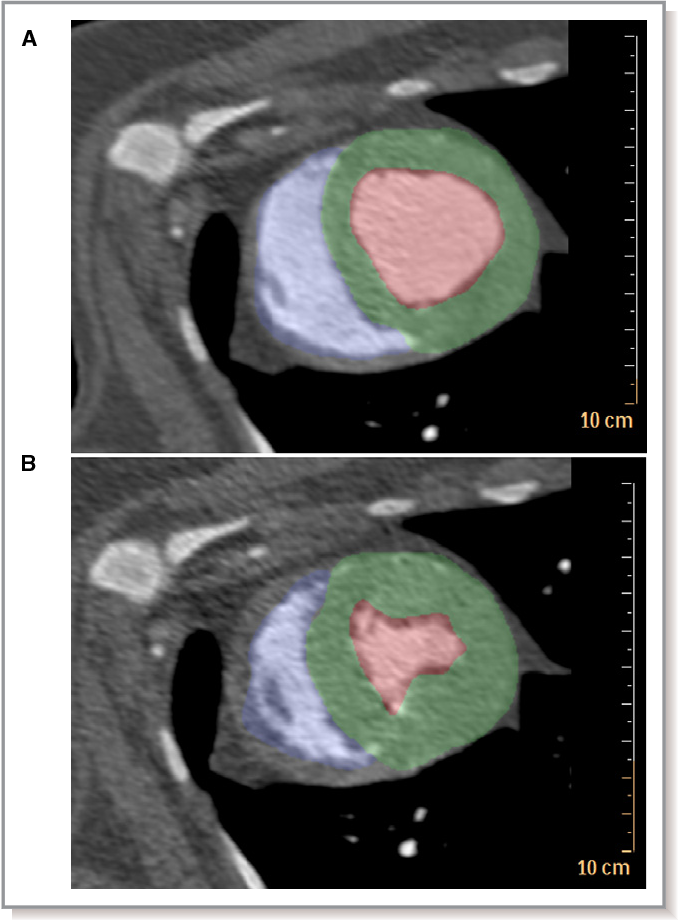
4
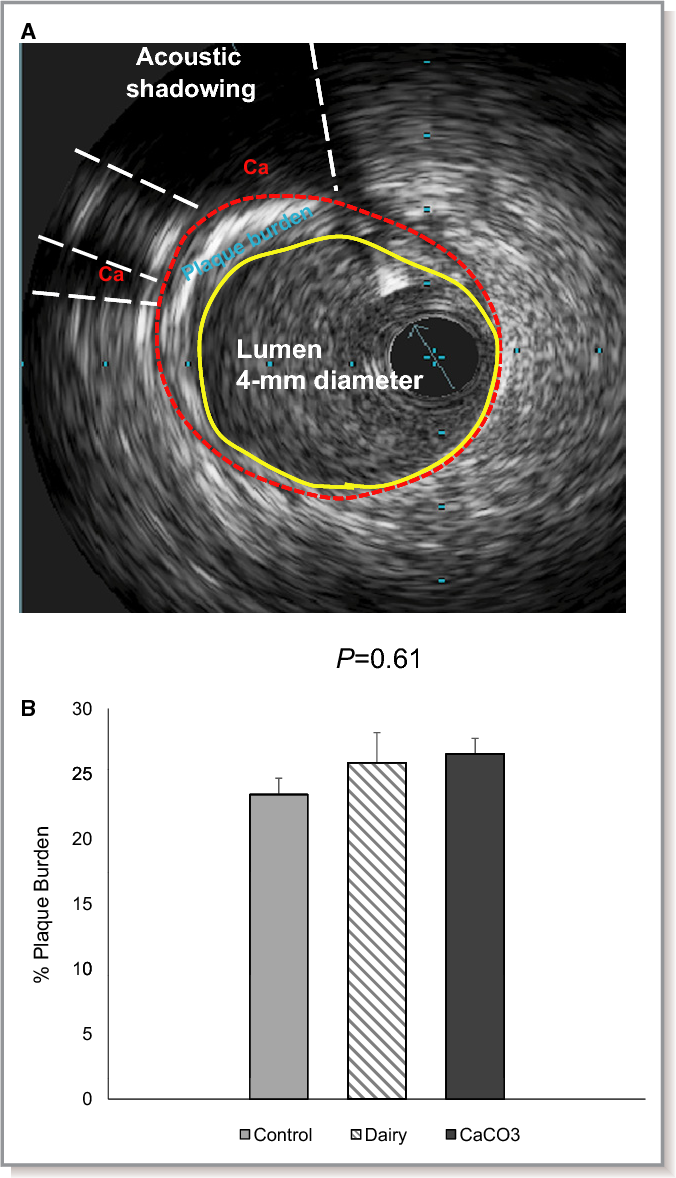
|
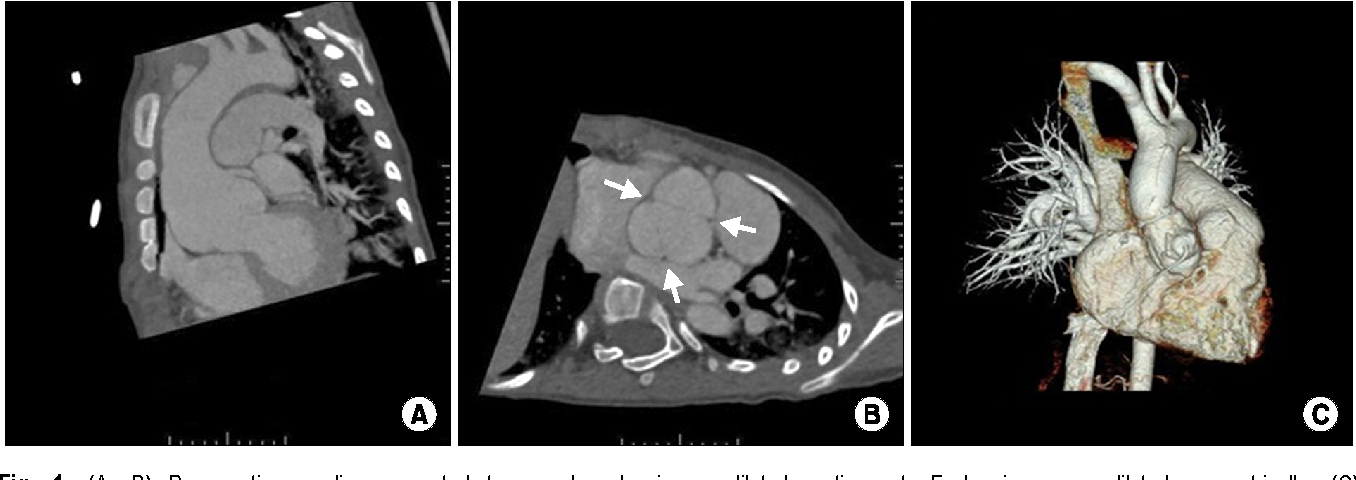
medicat__00000003
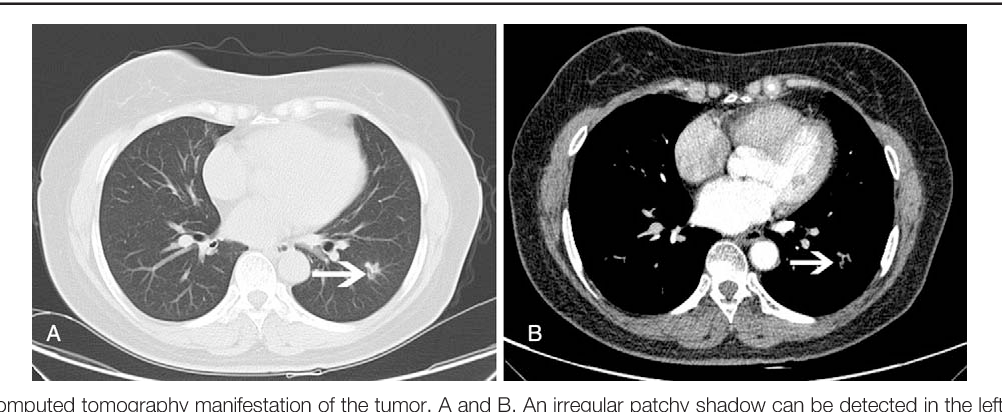
|
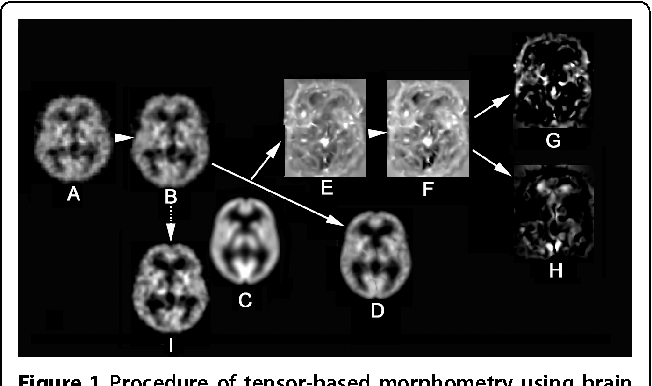
|
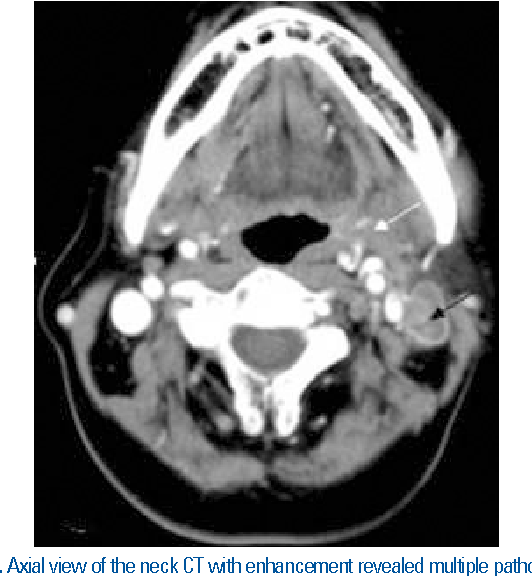
<|img1|>
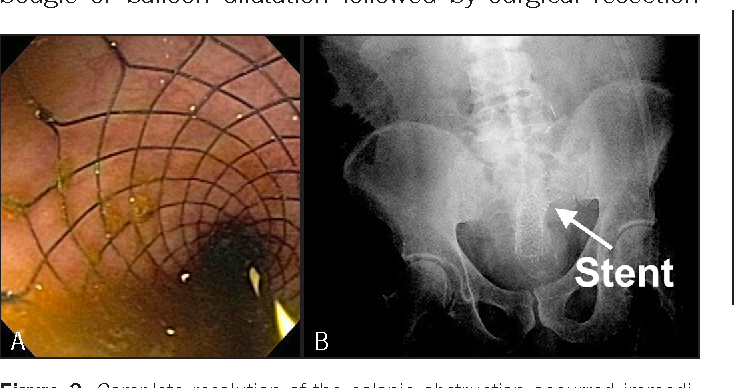
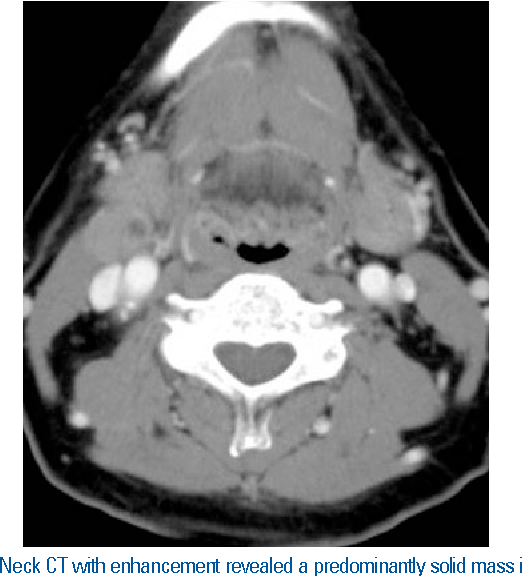
Figure 2. Complete resolution of the colonic obstruction occurred immediately after SEMS placement, as evidenced by (A) colonoscopy and (B) plain abdominal radiograph.
|
5
|
medicat__00000004
|
|
<|img1|>
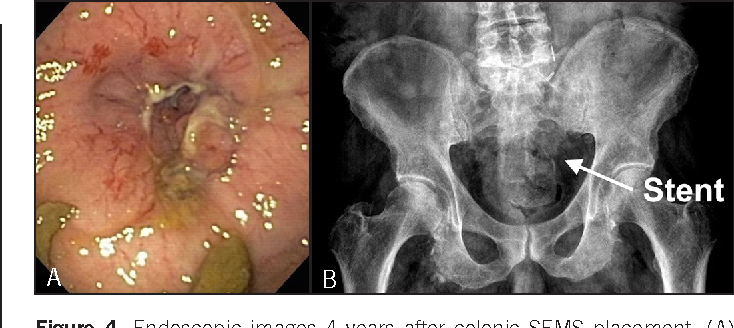
Figure 4. Endoscopic images 4 years after colonic SEMS placement. (A) Stricture at the site of the previously placed stents in the rectum with tissue hypertrophy and a small ulcer. (B) Although no visible stents were seen during the colonoscopy, a portion of the stents was visualized on abdominal radiograph.
|
6
|
medicat__00000005
|
|
<|img1|>
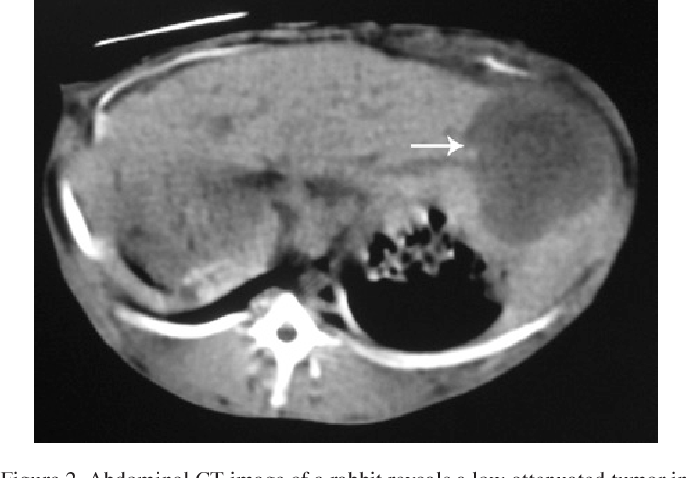
Figure 2. Abdominal CT image of a rabbit reveals a low-attenuated tumor in the left lobe of the liver (arrow). CT, computed tomography.
|
7
|
medicat__00000006
|
|
<|img1|>
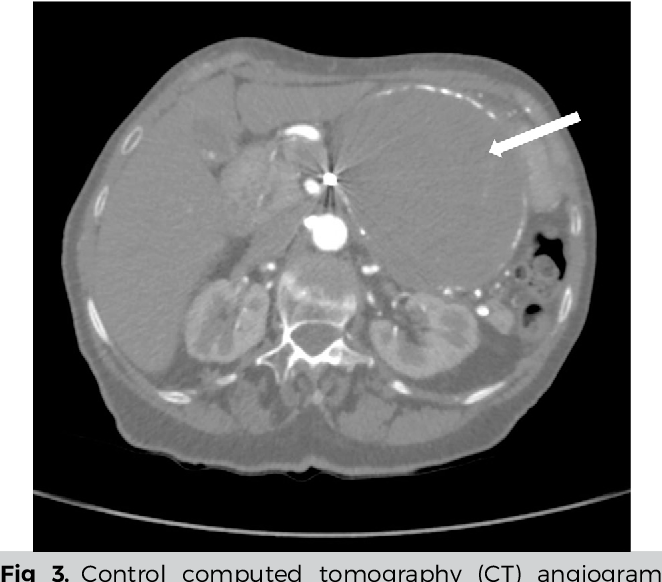
Fig 3. Control computed tomography (CT) angiogram 3 months postoperatively.
|
8
|
medicat__00000007
|
|
<|img1|>
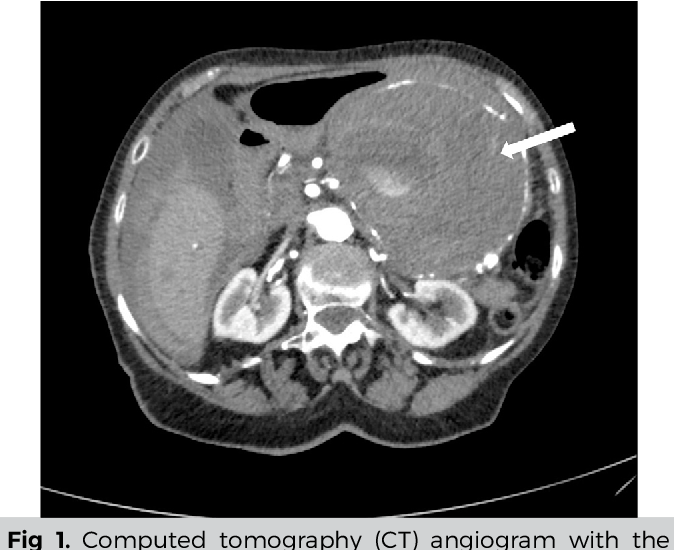
Fig 1. Computed tomography (CT) angiogram with the ruptured splenic artery aneurysm (SAA) and free fluid in the abdomen around the liver and in the fossa of Douglas.
|
9
|
medicat__00000008
|
|
<|img1|>
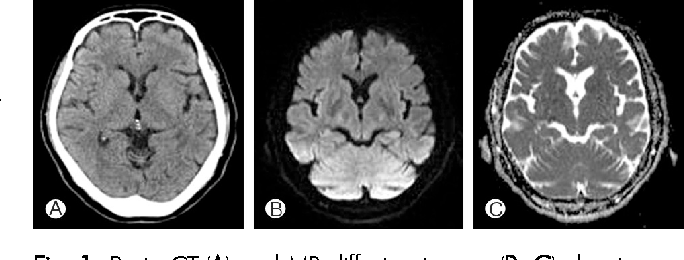
Fig. 1. Brain CT (A) and MR diffusion images (B, C) showing no intracranial lesion.
|
10
|
medicat__00000009
|
|
<|img1|>
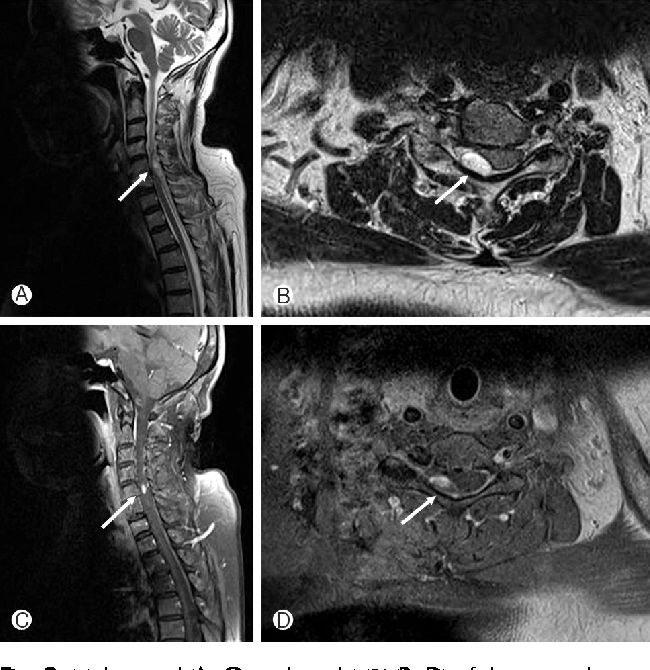
Fig. 2. Mid sagittal (A, C) and axial MRI (B, D) of the cervical spine showing a mass like lesion with enhancement.
|
11
|
medicat__00000010
|
|
<|img1|>
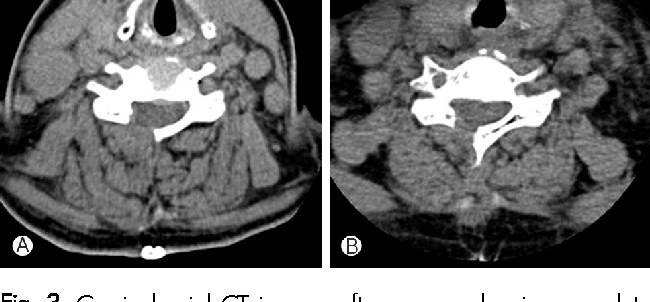
Fig. 3. Cervical axial CT images after surgery showing complete hematoma evacuation (A: C5 level, B: C6 level, respectively).
|
12
|
medicat__00000011
|
|
<|img1|>
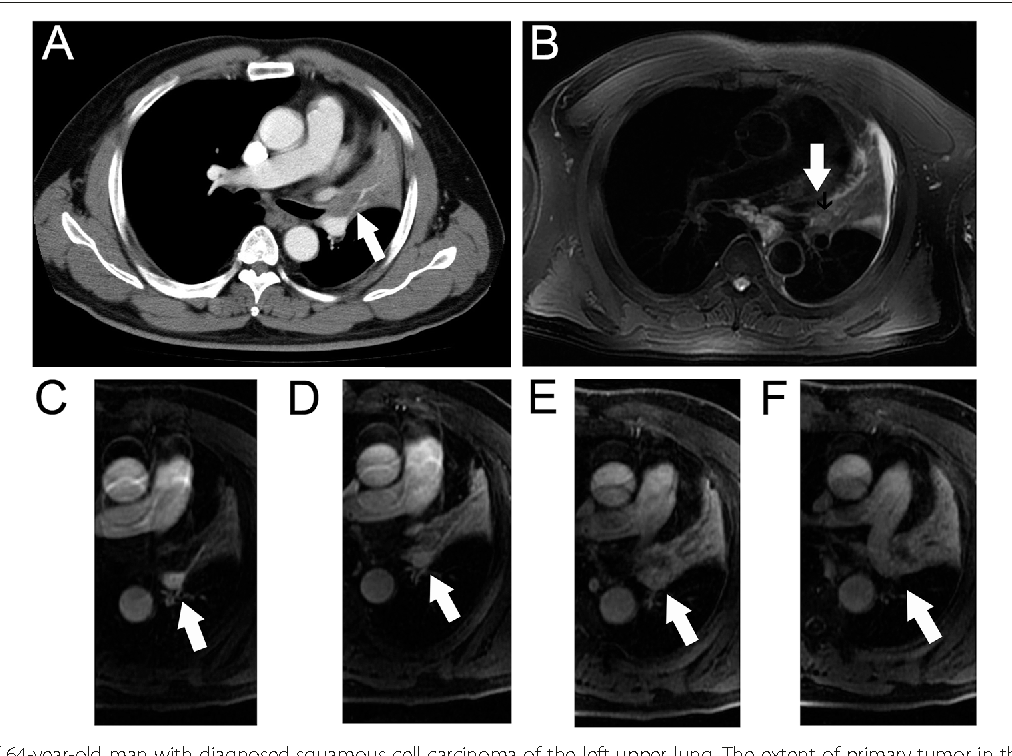
Fig. 1 Images of 64-year-old man with diagnosed squamous cell carcinoma of the left upper lung. The extent of primary tumor in the left hilum (arrow) was not accurately distinguished from the secondary changes on axial MDCT (a). Tumor (arrow) was appeared as slightly hypointense compared the signal of secondary changes on axial T2-weighted MRI (b). Tumor (arrow) was showed as hypointense while that of secondary changes were hyperintense in early phase of dynamic contrast-enhanced MRI (c and d), in delay phase both of them were appeared as heterogeneously hyperintanse (e and f)
|
13
|
medicat__00000012
|
|
<|img1|>
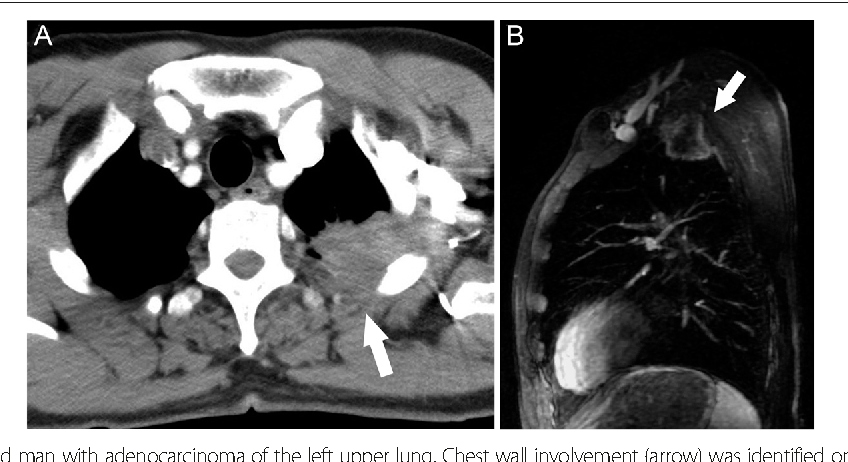
Fig. 3 Images of 60-year-old man with adenocarcinoma of the left upper lung. Chest wall involvement (arrow) was identified on axial MDCT (a). Tumor was presented as heterogeneous enhancement and was invading into the extrapleural fat plan (arrow) on saggital image of contrast-enhanced MRI (b)
|
14
|
medicat__00000013
|
|
<|img1|>
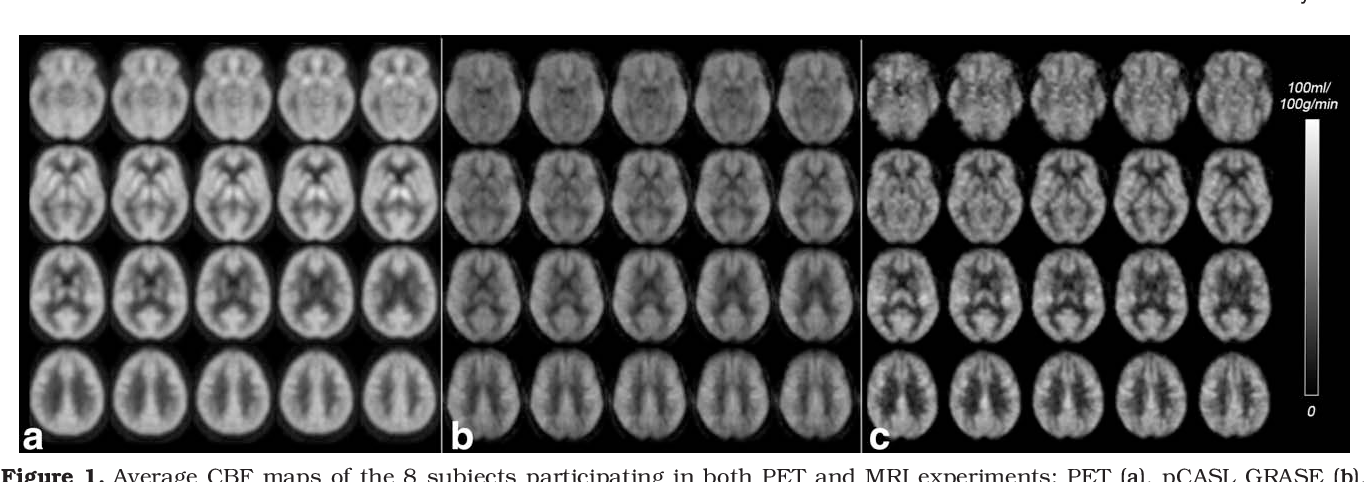
Figure 1. Average CBF maps of the 8 subjects participating in both PET and MRI experiments: PET (a), pCASL GRASE (b), and pCASL EPI (c). PET rCBF maps were scaled to a global mean CBF value of 50 mL/100 g/min.
|
15
|
medicat__00000014
|
|
<|img1|>
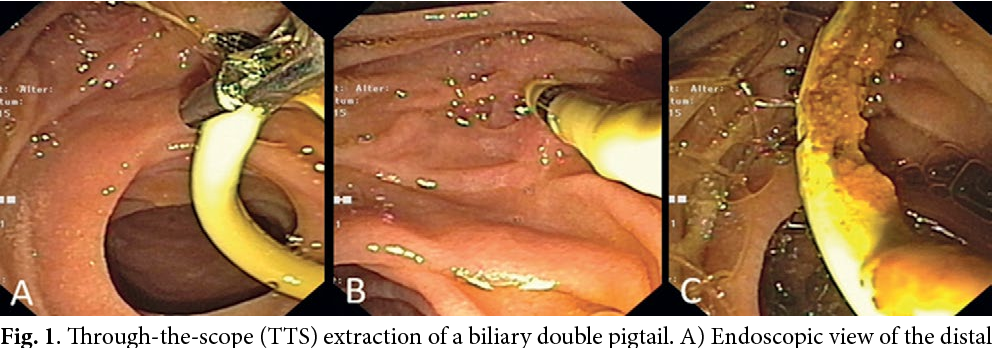
Fig. 1. Through-the-scope (TTS) extraction of a biliary double pigtail. A) Endoscopic view of the distal end of a 10 F biliary double pigtail stent (GastroSoft, Optimed, Ettlingen, Germany) tangentially grasped with a forceps. B) Careful withdrawal of the stent into the working channel and through-the-scope with the elevator down. C) On further extraction large amounts of sludge adherent to the middle portion of the stent become visible (Olympus TJF-160VR, Olympus, Hamburg, Germany: working channel 4.2 mm).
|
16
|
medicat__00000015
|
|
<|img1|>
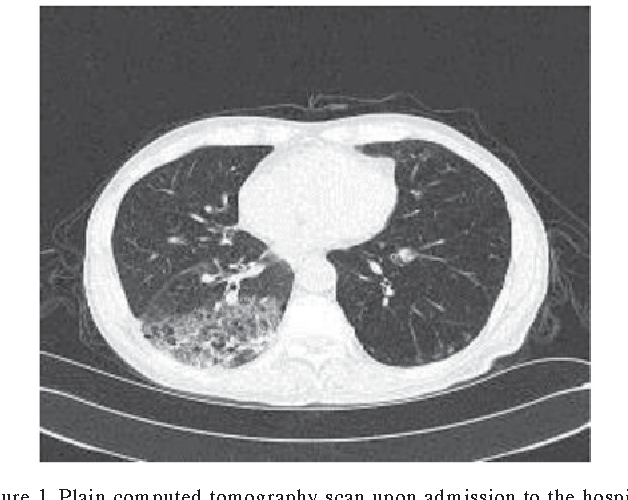
Figure 1. Plain computed tomography scan upon admission to the hospital, demonstrating patchy and macular lesions in the patient's bilateral pulmonary lobe, and macular lesions in right lower lobe were observed.
|
17
|
medicat__00000016
|
|
<|img1|>
Figure 2. Plain computed tomography scan performed three weeks after the
|
18
|
medicat__00000017
|
|
<|img1|>
Figure 5. Plain computed tomography image on completion of two months treatment, revealing almost complete resolution of consolidation in the patient's right lower lobe.
|
19
|
medicat__00000018
|
|
<|img1|>
Figure 4. Plain computed tomography image obtained 2 weeks after
|
20
|
medicat__00000019
|
|
<|img1|>
Fig. 2. (B, D) Cerebral magnetic resonance imaging 2 hours after endoscopic retrograde cholangiopancreatography shows multiple hypointense lesions in the subcortical and periventricular white matter. (A, C) The lesions were also hypodense on cerebral computed tomography.
|
21
|
medicat__00000020
|
|
<|img1|>
Figure 1. Neck CT scans show a 2.1cm sized well-defined, poorly enhancing mass (arrow) with calcification in the right parotid space, without invasion of the adjacent structures.
|
22
|
medicat__00000021
|
|
<|img1|>
Figure 1. CT-based VBM procedure. (A) A slice from an original CT image. (B) Gray matter extracted from (A) using the segmentation module in SPM8. (C) White matter extracted from (B). (D) A priori template of gray matter in SPM8. (E) Spatially normalized gray matter image using (D). (F) Image smoothed to the Gaussian distribution. CT, computed tomography; VBM, voxel-based morphometry; SPM8, statistical parametric mapping 8.
|
23
|
medicat__00000022
|
|
<|img1|>
Figure 2. Significant reduction of regional gray matter volume is noted in the bilateral medial temporal cortex, temporopolar areas, right caudate, and anterior cingulate in AD patients with CT-VBM. Upper row: The SPM of the t statistics is displayed in a standard format as a maximum intensity projection viewed from the right hand side (left image), the back (middle image), and the top (right image) of the brain. The anatomic space corresponds to the atlas of Talairach and Tournoux. Lower row: Significance maps of decreased gray matter volume in AD patients superimposed on a T1-weighted brain MRI template image in Montreal Neurological Institute (MNI) space. The color bar represents the t value. AD, Alzheimer’s disease; CT, computed tomography; VBM, voxel-based morphometry; SPM, statistical parametric mapping; MRI, magnetic resonance imaging.
|
24
|
medicat__00000023
|
|
<|img1|>
Figure 3. Significant reduction of regional gray matter volume is noted in the bilateral medial temporal cortex in AD patients with MR-VBM. Upper row: The SPM of the t statistics is displayed in a standard format as a maximum intensity projection viewed from the right hand side (left image), the back (middle image), and the top (right image) of the brain. The anatomic space corresponds to the atlas of Talairach and Tournoux. Lower row: Significance maps of decreased gray matter volume in AD patients superimposed on a T1-weighted brain MRI template image in Montreal Neurological Institute (MNI) space. The color bar represents the t value. AD, Alzheimer’s disease; MR-VBM, magnetic resonance based voxel-based morphometry; SPM, statistical parametric mapping; MRI, magnetic resonance imaging.
|
25
|
medicat__00000024
|
|
<|img1|>
Figure 3. Chest X-ray PA view Figure 4. Histopathology of skin lesion
|
26
|
medicat__00000025
|
|
<|img1|>
Figure 1. ECG-gated dynamic contrast-enhanced computed tomography allowed for quantification of end-diastolic volume and end-systolic volume to assess cardiac function in Ossabaw swine with metabolic syndrome. A, Diastole. B, Systole. Blue indicates the right ventricular cavity. Green indicates the left ventricle; Red indicates the left ventricular cavity.
|
27
|
medicat__00000026
|
|
<|img1|>
Figure 2. Intravascular ultrasound to assess plaque burden in Ossabaw swine LAD coronary artery. A, An intravascular ultrasound image showing stenotic plaque and calcified plaque (Ca, acoustic shadowing) in the LAD coronary artery. B, Percentage of plaque burden analysis of the proximal 1.5-cm LAD region. Data are means SEM. LAD indicates left anterior descending.
|
28
|
medicat__00000027
|
|
<|img1|>
Fig. 1. (A, B) Preoperative cardiac computed tomography showing a dilated aortic root. Each sinus was dilated symmetrically. (C) Postoperative cardiac computed tomography showing the aortic root replaced by a 24-mm Gelweave Valsalva graft (case 1). Arrows indicate each commissure of aortic the valve.
|
29
|
medicat__00000028
|
|
<|img1|>
Figure 1. The chest computed tomography manifestation of the tumor. A and B, An irregular patchy shadow can be detected in the left pulmonary lower lobe (arrow). There are fine burrs and proximal small bronchus truncation at the periphery.
|
30
|
medicat__00000029
|
|
<|img1|>
Figure 1 Procedure of tensor-based morphometry using brain SPECT. First, an original SPECT image (A) is linearly transformed to the Talairach space. Subsequent non-linear spatial normalization using the high-dimension-warping algorithm deforms a linearly standardized brain (B) to match it to a 99mTc-ECD template (C). This step generates a high-dimensionally warped SPECT image (D) and a parametric image of Jacobian determinants (E) indicating a local volume change relative to the template brain. Then the natural logarithm of this parametric image (F) is separated into negative log J (G) and positive log J maps (H) representing contraction and expansion respectively. A conventionally warped SPECT image is also shown (I).
|
31
|
medicat__00000030
|
|
<|img1|>
Fig. 1. Axial view of the neck CT with enhancement revealed multiple pathologic lymph nodes of the left upper internal jugular chain and cervical lymph node group II (black arrow) and a primary lesion of the left palatine tonsil (white arrow).
|
32
|
medicat__00000031
|
|
<|img1|>
Fig. 2. Neck CT with enhancement revealed a predominantly solid mass in the right parapharyngeal space at the level of the oropharynx.
|