| # | file_id | caption | vlm_description | tikz_code | source | png_image |
|---|
1
|
arxiv_src_new_528_716_64_0
|
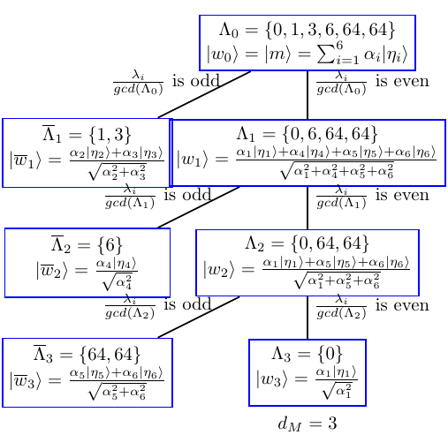
The process of computing $d_M$, $\Lambda_0$, $|w_0\rangle$ and $\Lambda_k$, \overline\Lambda
|
A diagram is presented with four blue-framed boxes arranged in a 2x2 grid. Each box contains mathematical expressions related to sets $\Lambda_i$, weights $|w_i|$, and norms $\overline{w}_i$. The first row includes:

- Box 1: $\Lambda_0 = \{0, 1, 3, 6, 64, 64\}$, $|w_0| = |m\rangle = \sum_{i=1}^{6} \alpha_i |\eta_i\rangle$, with a label $\frac{\lambda_i}{gcd(\Lambda_0)}$ pointing to the left indicating "is odd" and another arrow pointing right indicating "is even".
- Box 2: $\Lambda_1 = \{1, 3\}$, $|w_1\rangle = \frac{\alpha_2|\eta_2\rangle + \alpha_3|\eta_3\rangle}{\sqrt{\alpha_2^2 + \alpha_3^2}}$, with similar labeling for odd and even gcd.

The second row includes:

- Box 3: $\Lambda_2 = \{6\}$, $|w_2\rangle = \frac{\alpha_4|\eta_4\rangle}{\sqrt{\alpha_4^2}}$, with the same odd/even gcd labeling.
- Box 4: $\Lambda_3 = \{64, 64\}$, $|w_3\rangle = \frac{\alpha_5|\eta_5\rangle + \alpha_6|\eta_6\rangle}{\sqrt{\alpha_5^2 + \alpha_6^2}}$, again with odd/even gcd labeling.

Below the grid, a label $d_M = 3$ is positioned centrally. The entire diagram is enclosed within a larger blue frame.
|
\documentclass[tikz]{standalone}

\usepackage{amsmath, amsthm, amssymb,amsfonts, graphicx, subfigure}
\usepackage[colorlinks,citecolor=blue,linkcolor=blue, urlcolor=blue, anchorcolor=blue]{hyperref}
\usepackage{color}
\usepackage{tcolorbox}
\usepackage{tikz}

\begin{document}

\begin{tikzpicture} [sibling distance =120pt,level distance=60pt,thick=1, scale=1, every node/.style={scale=1}]
				\node(A)[rectangle,minimum width =20pt,minimum height =20pt ,draw=blue,align=center] {$\Lambda_0=\{0,1,3,6,64,64\}$\\$|{w}_0\rangle=|m\rangle=\sum_{i=1}^{6}\alpha_i |\eta_i\rangle$}
				child {
					node (B)[rectangle,minimum width =90pt ,minimum height =20pt ,draw=blue,align=center] {$\overline{\Lambda}_1=\{1,3\}$\\$|\overline{w}_1\rangle=\frac{\alpha_2 |\eta_2\rangle+\alpha_3 |\eta_3\rangle}{\sqrt{\alpha_2^2+\alpha_3^2}}$}
				}
				child {node(C)[rectangle,minimum width =20pt,minimum height =20pt ,draw=blue,align=center]  {$\Lambda_1=\{0,6,64,64\}$\\$|{w}_1\rangle =\frac{\alpha_1 |\eta_1\rangle+\alpha_4 |\eta_4\rangle+\alpha_5 |\eta_5\rangle+\alpha_6 |\eta_6\rangle}{\sqrt{\alpha_1^2+\alpha_4^2+\alpha_5^2+\alpha_6^2}}$}
					child {node(D)[rectangle,minimum width =90pt,minimum height =20pt ,draw=blue,align=center]  {$\overline{\Lambda}_2=\{6\}$\\$|\overline{w}_2\rangle=\frac{\alpha_4 |\eta_4\rangle}{\sqrt{\alpha_4^2}}$}
					}
					child {node(E)[rectangle,minimum width =20pt,minimum height =20pt ,draw=blue,align=center]{$\Lambda_2=\{0,64,64\}$\\$|{w}_2\rangle =\frac{\alpha_1 |\eta_1\rangle+\alpha_5 |\eta_5\rangle+\alpha_6 |\eta_6\rangle}{\sqrt{\alpha_1^2+\alpha_5^2+\alpha_6^2}}$}
						child {node(F)[rectangle,minimum width =90pt,minimum height =20pt ,draw=blue,align=center]  {$\overline{\Lambda}_3=\{64,64\}$\\$|\overline{w}_3\rangle=\frac{\alpha_5 |\eta_5\rangle+\alpha_6 |\eta_6\rangle}{\sqrt{\alpha_5^2+\alpha_6^2}}$}
						}
						child {node(G)[rectangle,minimum width =20pt,minimum height =20pt ,draw=blue,align=center] {$\Lambda_3=\{0\}$\\$|{w}_3\rangle =\frac{\alpha_1 |\eta_1\rangle}{\sqrt{\alpha_1^2}} $}
						}
						child [missing] {}
					}
					child [missing] {}
				}
				child [missing] {}
				;
				\begin{scope}[nodes = {draw = none}]
					\path (A) -- (B) node [near start, left]  {$\frac{\lambda_i}{gcd(\Lambda_{0}) }$ is odd};
					\path (A) -- (C) node [near start, right]  {$\frac{\lambda_i}{gcd(\Lambda_{0})}$ is even};
					\path (C) -- (D) node [near start, left]  {$\frac{\lambda_i}{gcd(\Lambda_{1})}$ is odd};
					\path (C) -- (E) node [near start, right]  {$\frac{\lambda_i}{gcd(\Lambda_{1})}$ is even};
					\path (E) -- (F) node [near start, left]  {$\frac{\lambda_i}{gcd(\Lambda_{2})}$ is odd};
					\path (E) -- (G) node [near start, right]  {$\frac{\lambda_i}{gcd(\Lambda_{2})}$ is even};
					\begin{scope}[nodes = {below = 20pt}]
						\node            at (G) {$d_M=3$};
					\end{scope}
				\end{scope}
			\end{tikzpicture}

\end{document}
|
arxiv
|
|
2
|
arxiv_src_new_528_716_62_0
|
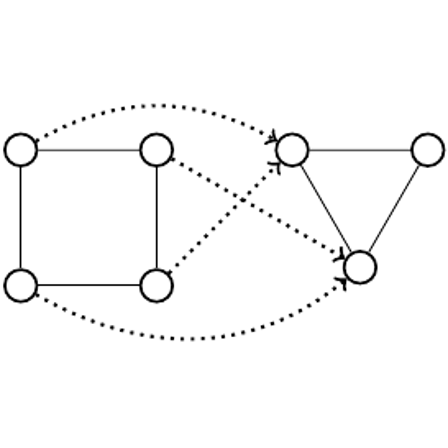
Example homomorphism: mapping a 4-cycle to an edge.
|
A square grid of four circles is positioned in the upper left quadrant, with each circle connected to its adjacent circles by solid black lines forming a square. A dotted line extends from the top right corner of the square, curving downward and then upward to connect to another circle located below and to the right of the square. This connecting line is also dotted and contains two small arrowheads pointing towards the connecting point. Another dotted line originates from the bottom right corner of the square, curving upwards and then to the left to connect to a circle located above and to the left of the square. This line also contains two small arrowheads pointing towards the connecting point. The circles are evenly spaced within the square, and the overall layout suggests a network or flow diagram.
|
\documentclass[tikz]{standalone}

\usepackage{amsmath}
\usepackage{amssymb}
\usepackage{color}
\usepackage{tikz}
\usetikzlibrary{calc}
\usepackage{amsthm, amsmath, amssymb}

\begin{document}

\begin{tikzpicture}[scale=.7]
        \begin{scope}[every node/.style={circle,thick,draw}]
\node (T1) at (4,4) {};
            \node (T2) at (6,4) {};
            \node (T3) at (5, 4-1.73) {};
            \draw (T1) -- (T2);
            \draw (T2) -- (T3);
            \draw (T1) -- (T3);
\node (A1) at (0,4) {};
            \node (A2) at (2,4) {};
            \node (A3) at (2,2) {};
            \node (A4) at (0,2) {};
            \draw (A1) -- (A2);
            \draw (A3) -- (A4);
            \draw (A1) -- (A4);
            \draw (A3) -- (A2);
            \draw [->, dotted, line width=0.35mm] (A1) to [out=30,in=150] (T1);
            \draw [->, dotted, line width=0.35mm] (A4) to [out=330,in=220] (T3);
            \draw [->, dotted, line width=0.35mm] (A3) to  (T1);
            \draw [->, dotted, line width=0.35mm] (A2) to (T3);
        \end{scope}
    \end{tikzpicture}

\end{document}
|
arxiv
|
|
3
|
arxiv_src_new_528_716_73_1
|
Ground truth and model prediction on SemanticPOSS dataset, Semantic-KITTI dataset, and FLORIDA dataset
|
The image features two words: "Ground Truth" and "Semantics". "Ground Truth" is positioned above "Semantics", both words are written in a serif font. "Ground Truth" is slightly larger than "Semantics". Both words are aligned horizontally and centered within the image. The text is colored black, with no additional decorative elements or background.
|
\documentclass[tikz]{standalone}

\usepackage{tikz}
\usepackage{pgfplots}
\usetikzlibrary{arrows.meta, decorations.pathreplacing, positioning, shapes, calc}

\begin{document}

\begin{tikzpicture}
    \node (image) {};
    \node [above = 0.0cm and 0.0cm of image] {Ground Truth};
    \node [left = 0.0cm and 0.0cm of image] {\rotatebox{90}{SemanticPOSS}};
    \end{tikzpicture}

\end{document}
|
arxiv
|
|
4
|
arxiv_src_new_528_716_73_2
|
Ground truth and model prediction on SemanticPOSS dataset, Semantic-KITTI dataset, and FLORIDA dataset
|
The word "Prediction" is centrally aligned within a white rectangular box, which occupies most of the image space. The text is in a serif font, black in color, and positioned slightly below the center of the rectangle. The rectangle is bordered by a thin black line, creating a subtle frame around the text. The background outside the rectangle is plain white, providing contrast to the black text and the black border.
|
\documentclass[tikz]{standalone}

\usepackage{tikz}
\usepackage{pgfplots}
\usetikzlibrary{arrows.meta, decorations.pathreplacing, positioning, shapes, calc}

\begin{document}

\begin{tikzpicture}
    \node (image) {};
    \node [above = 0.0cm and 0.0cm of image] {Prediction};
    \end{tikzpicture}

\end{document}
|
arxiv
|

|
5
|
arxiv_src_new_528_716_73_3
|
Ground truth and model prediction on SemanticPOSS dataset, Semantic-KITTI dataset, and FLORIDA dataset
|
The image displays the text "Semantic-KITTI" in a serif font, positioned centrally within a rectangular frame. The text is oriented vertically, with the word "Semantic" at the top and "KITTI" at the bottom. The font color appears to be dark gray or black, and the letters are evenly spaced. The background of the rectangle is white, providing a stark contrast to the text. The rectangle itself is outlined with a thin black border, which is slightly thicker than the text's stroke but not prominent enough to draw attention away from the text. The overall design is simple and clean, focusing entirely on the text without any additional graphical elements or decorations.
|
\documentclass[tikz]{standalone}

\usepackage{tikz}
\usepackage{pgfplots}
\usetikzlibrary{arrows.meta, decorations.pathreplacing, positioning, shapes, calc}

\begin{document}

\begin{tikzpicture}
    \node (image) {};
    \node [left = 0.0cm and 0.0cm of image] {\rotatebox{90}{Semantic-KITTI}};
    \end{tikzpicture}

\end{document}
|
arxiv
|
|
6
|
arxiv_src_new_528_716_73_5
|
Ground truth and model prediction on SemanticPOSS dataset, Semantic-KITTI dataset, and FLORIDA dataset
|
The word "FLORIDA" is written vertically in uppercase letters, aligned to the right side of the image. Each letter is separated by a small gap, and the font appears to be sans-serif. The text is colored black, and there are no additional elements or decorations present in the image.
|
\documentclass[tikz]{standalone}

\usepackage{tikz}
\usepackage{pgfplots}
\usetikzlibrary{arrows.meta, decorations.pathreplacing, positioning, shapes, calc}

\begin{document}

\begin{tikzpicture}
    \node (image) {};
    \node [left = 0.0cm and 0.0cm of image] {\rotatebox{90}{FLORIDA}};
    \end{tikzpicture}

\end{document}
|
arxiv
|

|
7
|
arxiv_src_new_528_716_72_1
|
Ground truth and model prediction on SemanticPOSS dataset, Semantic-KITTI dataset, and FLORIDA dataset
|
The image features two words, "Ground Truth" and "Semantic POSS," arranged vertically. "Ground Truth" is positioned at the top, slightly offset to the right, with its letters stacked in a vertical alignment. Below it, "Semantic POSS" is written in a similar vertical alignment but slightly offset to the left. Both words are in a serif font, with "Ground Truth" in a larger size than "Semantic POSS." The text is colored in black, and there are no additional lines, arrows, or labels present in the image.
|
\documentclass[tikz]{standalone}

\usepackage{amsmath,amsfonts}
\usepackage{amsmath}
\usepackage{tikz}
\usetikzlibrary{positioning}

\begin{document}

\begin{tikzpicture}
    \node (image) {};
    \node [above = 0.0cm and 0.0cm of image] {Ground Truth};
    \node [left = 0.0cm and 0.0cm of image] {\rotatebox{90}{SemanticPOSS}};
    \end{tikzpicture}

\end{document}
|
arxiv
|
|
8
|
arxiv_src_new_528_716_72_2
|
Ground truth and model prediction on SemanticPOSS dataset, Semantic-KITTI dataset, and FLORIDA dataset
|
The word "Prediction" is centrally aligned within a white rectangular box, which occupies most of the image space. The text is in a serif font, black in color, and positioned slightly below the center of the rectangle. The rectangle is bordered by a thin black line, creating a subtle frame around the text. The background outside the rectangle is plain white, providing contrast to the black text and the black border.
|
\documentclass[tikz]{standalone}

\usepackage{amsmath,amsfonts}
\usepackage{amsmath}
\usepackage{tikz}
\usetikzlibrary{positioning}

\begin{document}

\begin{tikzpicture}
    \node (image) {};
    \node [above = 0.0cm and 0.0cm of image] {Prediction};
    \end{tikzpicture}

\end{document}
|
arxiv
|
|
9
|
arxiv_src_new_528_716_72_3
|
Ground truth and model prediction on SemanticPOSS dataset, Semantic-KITTI dataset, and FLORIDA dataset
|
The image displays the text "Semantic-KITTI" in a serif font, positioned centrally within a rectangular frame. The text is oriented vertically, with each letter stacked one above the other. The letters are evenly spaced both horizontally and vertically, and the font size appears uniform across all characters. The background of the rectangle is white, and there are no additional elements or decorations present in the image.
|
\documentclass[tikz]{standalone}

\usepackage{amsmath,amsfonts}
\usepackage{amsmath}
\usepackage{tikz}
\usetikzlibrary{positioning}

\begin{document}

\begin{tikzpicture}
    \node (image) {};
    \node [left = 0.0cm and 0.0cm of image] {\rotatebox{90}{Semantic-KITTI}};
    \end{tikzpicture}

\end{document}
|
arxiv
|
|
10
|
arxiv_src_new_528_716_72_5
|
Ground truth and model prediction on SemanticPOSS dataset, Semantic-KITTI dataset, and FLORIDA dataset
|
The word "FLORIDA" is written vertically in uppercase letters, aligned to the right side of the image. Each letter is separated by a small gap, and the font appears to be sans-serif. The text is colored black, and there are no additional elements or decorations present in the image.
|
\documentclass[tikz]{standalone}

\usepackage{amsmath,amsfonts}
\usepackage{amsmath}
\usepackage{tikz}
\usetikzlibrary{positioning}

\begin{document}

\begin{tikzpicture}
    \node (image) {};
    \node [left = 0.0cm and 0.0cm of image] {\rotatebox{90}{FLORIDA}};
    \end{tikzpicture}

\end{document}
|
arxiv
|
|