| # | image_id | file | caption | text_references | tag | case_id | article_id | file_id | patient_id | license | image |
|---|
1
|
PMC5015624_01_OC-05-14-g-001.jpg
|
PMC5015624_OC-05-14-g-001_undivided_1_1.webp
|
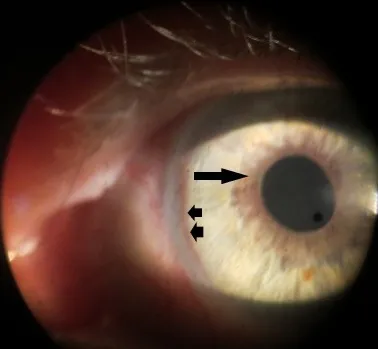
Slit lamp biomicroscopy of the anterior segment of the left eye shows marginal (arrow) and peripheral (arrowheads) circumferential neovascularization of the iris.
|
Slit lamp biomicroscopy showed iris neovascularization of both eyes (Figure 1 (Fig. 1)).
|
F1
|
PMC5015624_01
|
PMC5015624
|
file_0058641
|
PMC5015624_01
|
CC BY
|
|
2
|
PMC5015624_01_OC-05-14-g-004.jpg
|
PMC5015624_OC-05-14-g-004_undivided_1_1.webp
|
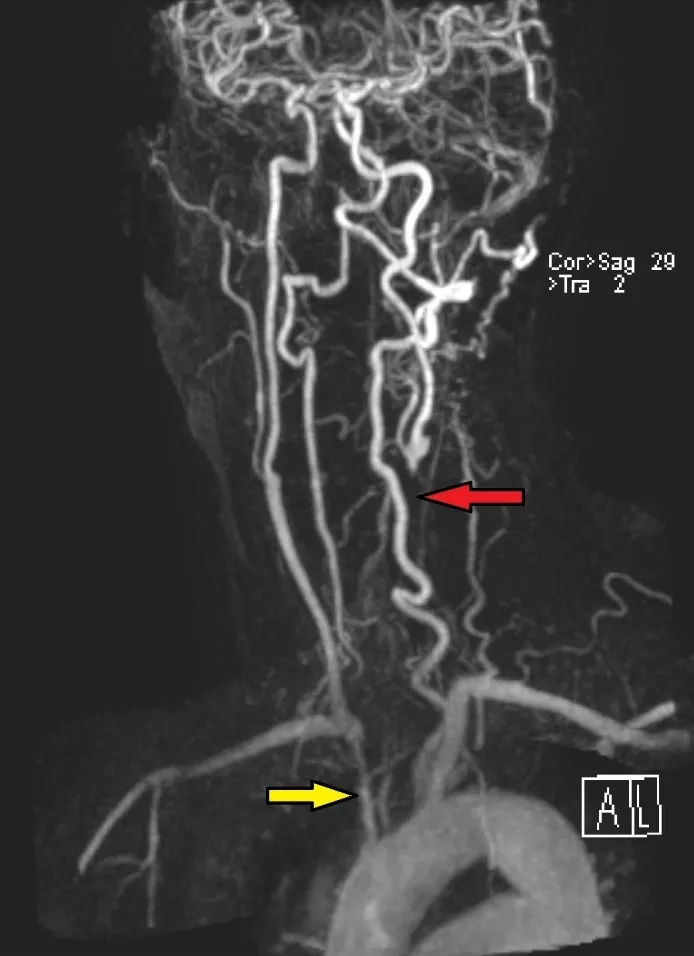
MRA extracranial showing severe narrowing of the origin of the right brachiocephalic artery (yellow arrow) and complete occlusion of the left common carotid artery with distal reconstitution of flow near the bifurcation (red arrow).
|
MRA Extracranial showed proximal occlusion of aortic arch branches (Figure 4 (Fig. 4)).
|
F4
|
PMC5015624_01
|
PMC5015624
|
file_0058642
|
PMC5015624_01
|
CC BY
|
|
3
|
PMC6381877_01_cro-0012-0091-g01.jpg
|
PMC6381877_cro-0012-0091-g01_a_1_2.webp
|
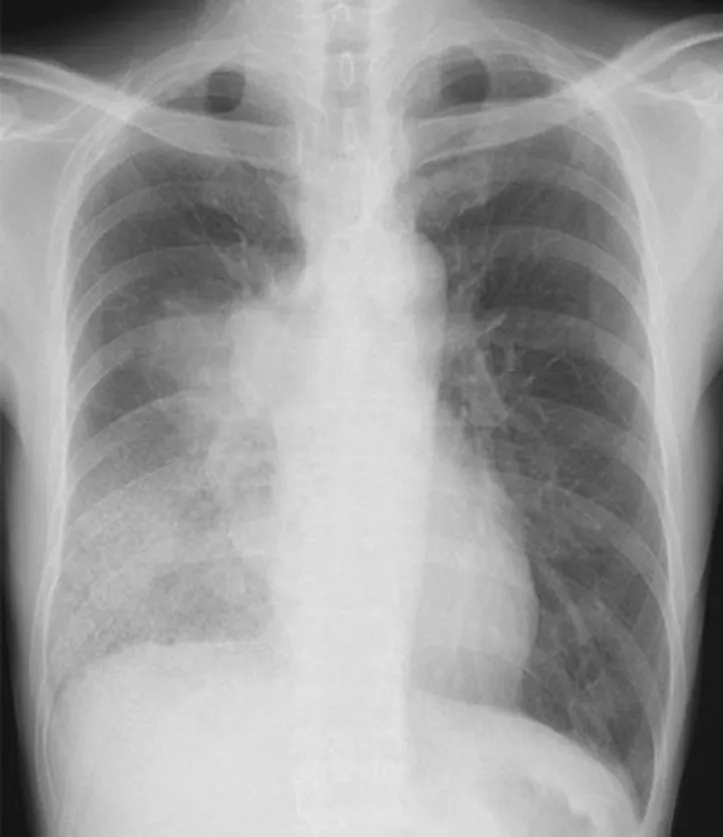
Chest X-ray and chest CT images before initial EGFR-TKI treatment. (a) Chest X-ray image showed a right hilar mass followed by lymphangitic carcinomatosis in the right lower lung field. (b) Chest CT image showed a large lung mass, extending to posterior chest wall and vertebral body, in the right lower lung as well as multiple lymphadenopathy and right pleural effusion.
|
In the imaging test of full body, chest X-ray and chest CT revealed a large lung mass, extending to posterior chest wall and vertebral body, surrounded by lymphangitic carcinomatosis in the right lower lung as well as multiple lymphadenopathy and right pleural effusion (Fig. 1a, b).
|
F1
|
PMC6381877_01
|
PMC6381877
|
file_0090206
|
PMC6381877_01
|
CC BY-NC
|
|
4
|
PMC6381877_01_cro-0012-0091-g02.jpg
|
PMC6381877_cro-0012-0091-g02_a_1_2.webp
|
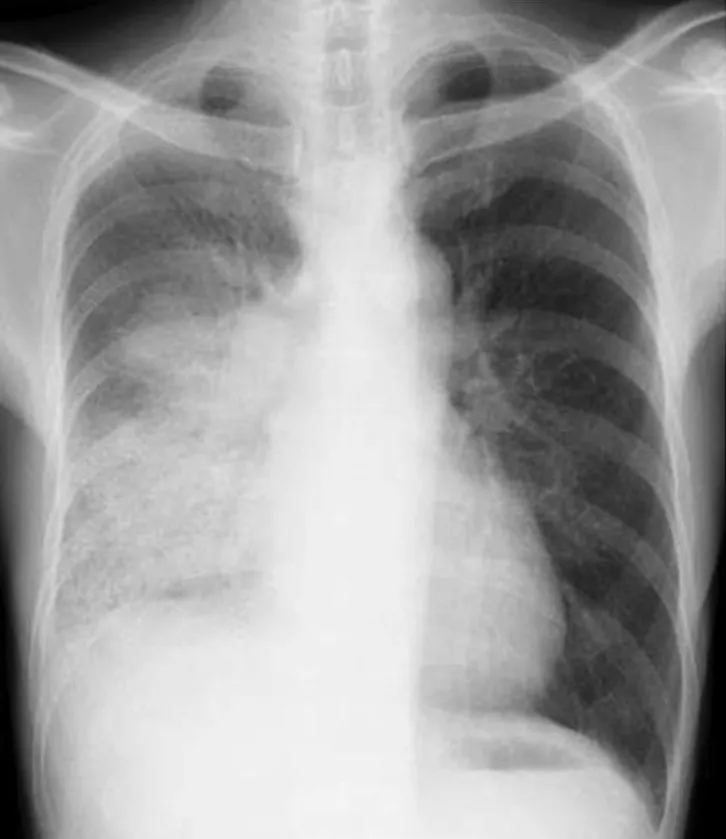
Chest X-ray and chest CT images after 28 days of gefitinib therapy. (a) Chest X-ray image showed the increased right hilar mass and the worsened lymphangitic carcinomatosis. (b) Chest CT image showed interval progression of the lung mass and the lymphadenopathy.
|
However, by 28 days after the start of gefitinib therapy, his symptoms further deteriorated along with the increased tumor size, resulting in PS 3 (Fig. 2a, b).
|
F2
|
PMC6381877_01
|
PMC6381877
|
file_0090208
|
PMC6381877_01
|
CC BY-NC
|
|
5
|
PMC5287946_01_medi-96-e5657-g002.jpg
|
PMC5287946_medi-96-e5657-g002_A_1_12.webp
|
Histopathological and immunohistochemical examination images for the surgical specimen. A-K, Specimen after the first surgery. A, H & E, x10. B, H & E, x20. C, AE-1/AE-3, x10. D, AS-1, x10. E, CD34, x10. F, CD68, x10. G, Desmin, x10. H, S-100 protein, x10. I, SMA, x10. J, SMA, x20. K, Vimentin, x10. L, Specimen after the third surgery, Ki-67 proliferation index 45%, x10. H & E = hematoxylin and eosin, SMA = smooth muscle actin.
|
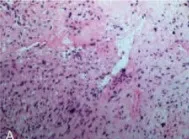
Ki-67 proliferation index was 6% (Fig. 2A-K).
ASCO. And the Ki-67 proliferation index increased to 45% (WHO III-IV grade, Fig. 2L), highly suggesting its malignancy.
|
F2
|
PMC5287946_01
|
PMC5287946
|
file_0063172
|
PMC5287946_01
|
CC BY
|
|
6
|
PMC9106225_01_JOMFP-26-101-g001.jpg
|
PMC9106225_JOMFP-26-101-g001_undivided_1_1.webp
|
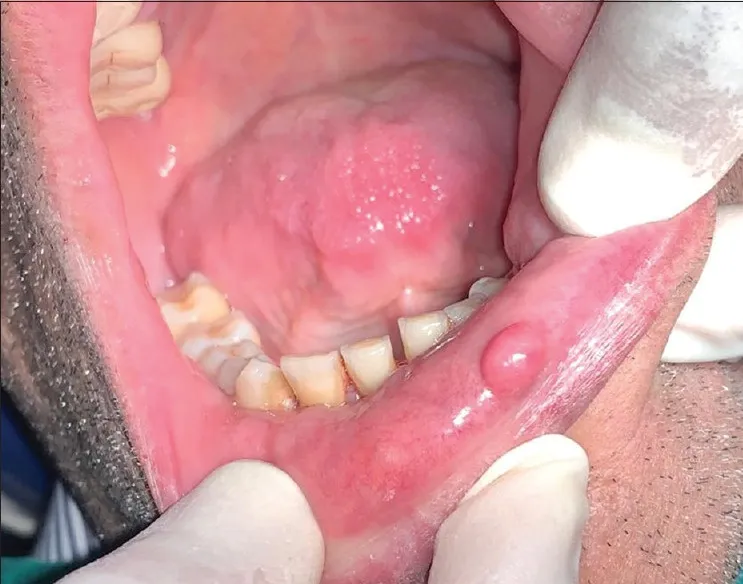
Clinical image shows a well-defined, roughly oval swelling on the lower lip
|
Clinical examination revealed a well-defined, nontender, smooth-surfaced, roughly oval, fluctuant swelling [Figure 1].
|
F1
|
PMC9106225_01
|
PMC9106225
|
file_0133164
|
PMC9106225_01
|
CC BY-NC-SA
|
|
7
|
PMC9106225_01_JOMFP-26-101-g002.jpg
|
PMC9106225_JOMFP-26-101-g002_undivided_1_1.webp
|
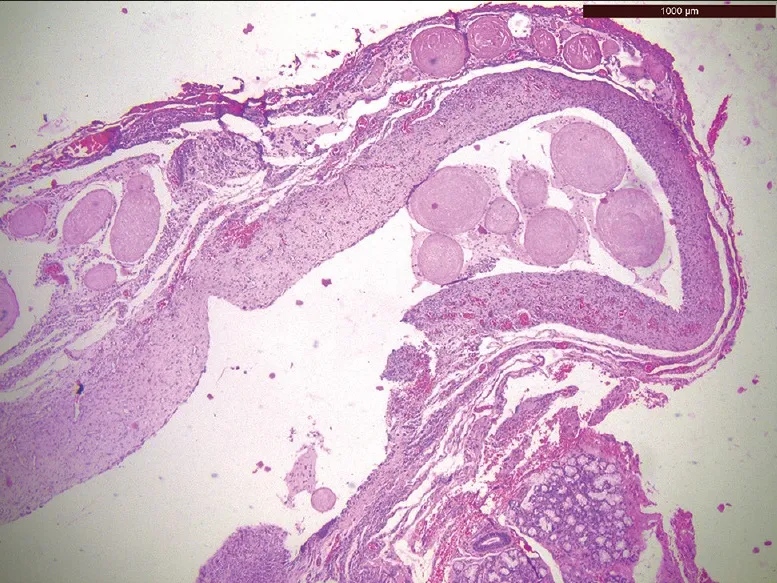
Histopathological image shows presence of large, eosinophilic globules having lamellated or whorled appearance (H&E stain, x4)
|
The lumen was filled with numerous mucinous globular structures which were oval or round in shape and of varying sizes [Figure 2].
|
F2
|
PMC9106225_01
|
PMC9106225
|
file_0133165
|
PMC9106225_01
|
CC BY-NC-SA
|
|
8
|
PMC9106225_01_JOMFP-26-101-g003.jpg
|
PMC9106225_JOMFP-26-101-g003_undivided_1_1.webp
|
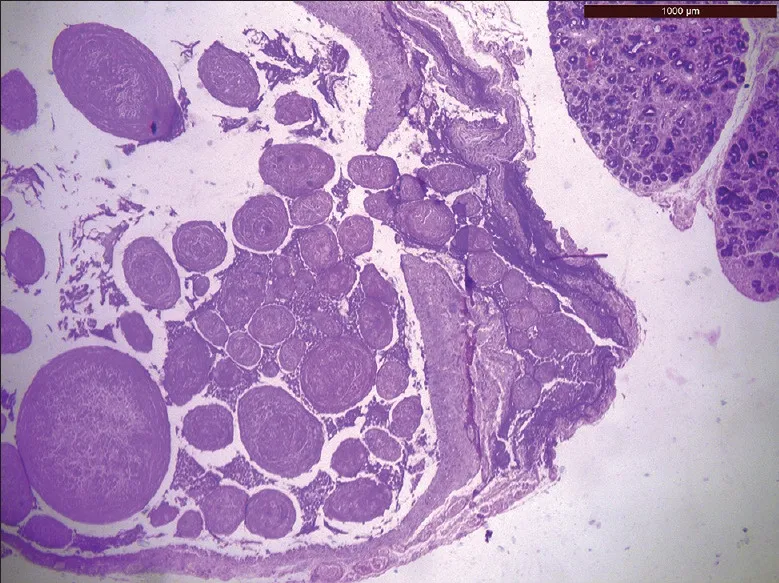
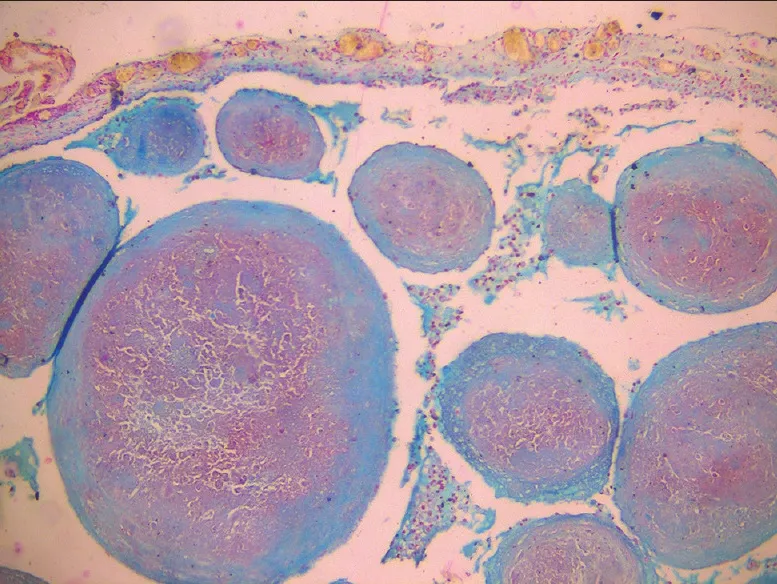
Histopathological image shows abundant mucin within the globules attached to the surrounding cystic capsule and few globules suspended freely within the lumen (PAS stain, x4)
|
Some of the globules were suspended freely within the lumen [Figure 3].
The mucinous globules showed positive results for PAS and Alcian blue [Figures 3 and 4].
|
F3
|
PMC9106225_01
|
PMC9106225
|
file_0133166
|
PMC9106225_01
|
CC BY-NC-SA
|
|
9
|
PMC9106225_01_JOMFP-26-101-g004.jpg
|
PMC9106225_JOMFP-26-101-g004_undivided_1_1.webp
|
Histopathological image shows presence of mucin in the periphery with central cellular core (Alcian blue stain, x10)
|
Individual globules exhibited a mildly cellular core with peripheral laminations of dystrophic calcifications [Figure 4].
The mucinous globules showed positive results for PAS and Alcian blue [Figures 3 and 4].
|
F4
|
PMC9106225_01
|
PMC9106225
|
file_0133167
|
PMC9106225_01
|
CC BY-NC-SA
|
|
10
|
PMC7276389_01_gr1.jpg
|
PMC7276389_gr1_a_1_2.webp
|
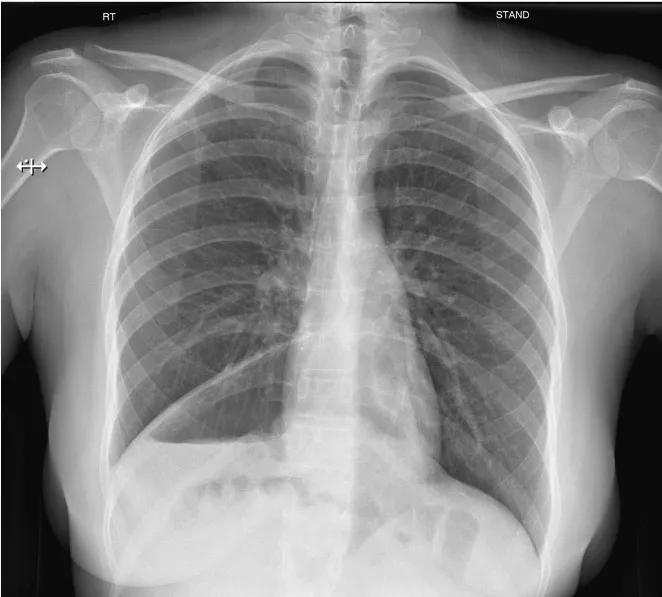
Pre-op x-ray chest with Chilaiditis Sign (a); Post-op x-ray chest (normal) (b).
|
Upon no improvement, the patient revisited the ED where chest x-ray (CXR) as primary imaging modality was requested by surgeon on-call that showed raised right hemidiaphragm with no well discernible outlines, air-filled bowel loops above the hepatic shadow, a chilaiditi's sign, with no mediastinal shift (Fig. 1a), thus a provisional diagnosis of the right-sided diagrammatic hernia was made.
Post-operative chest x-ray shows normal findings (Fig. 1b).
|
fig0005
|
PMC7276389_01
|
PMC7276389
|
file_0103415
|
PMC7276389_01
|
CC BY
|
|