| # | key | img1.jpg | txt |
|---|
1
|
open_pmc_18m__00000000
|
|
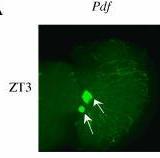
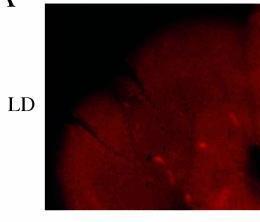
Rescuing Molecular Oscillations within the LNvs Is Not Sufficient to Rescue Locomotor Activity RhythmsThe rescued mutant genotype is y w;pdf–GAL4;UAS–CYC,cyc01/cyc01. The flies were entrained in standard LD conditions and timepoints taken. Molecular oscillations were examined by whole-mount in situ hybridization of the tim gene. Double staining with a Pdf probe was used to label the LNvs neuronal group.(A and B) These show representative duplicate experiments. No tim mRNA signal is detectable in the dorsal region of the brain. The lower arrows point to the s-LNvs and the upper arrows to the l-LNvs. (A) Brain taken at timepoint ZT3. Panels shown from left to right are Pdf (green, FITC labeled), tim (red, Cy3 labeled), and an image overlay. (B) Brain taken at timepoint ZT15. Panels shown from left to right are Pdf (green, FITC labeled), tim (red, Cy3 labeled), and an image overlay.(C) The double-plotted actograms of rescue mutant and control flies in a standard LD:DD behavior assay. The colors on the background indicate the lighting conditions of the behavior monitors (white, lights on; light blue, lights off). In the actogram, the average locomotor activity of the group of flies is plotted as a function of time. The left panel shows the actogram of the rescued mutant flies (y w;pdf–GAL4/+;UAS–CYC,cyc01/cyc01, n = 30). RI (rhythm index; Levine et al. 2002a) = 0.14. The right panel shows the actogram for the rescued wild-type (control) flies (y w;pdf–GAL4/+;UAS–CYC/+, n = 32, RI = 0.61).
|
2
|
open_pmc_18m__00000001
|
|
All Brain Clock Neuronal Groups Maintain Robust Oscillations of tim RNA Levels in DDWild-type flies were entrained for at least 3 days and then released into DD. tim RNA was assayed at trough (left panels) and peak (right panels) timepoints by whole-mount in situ hybridization. Wild-type flies in LD (A) were compared with the eighth day of DD (B). On the eighth day of DD, the locomotor activities of the fly population were still in close synchrony, without any obvious phase spreading (data not shown). Left panels, brains at ZT3 (A) or CT3 (B); right panels, brains from ZT15 (A) or CT15 (B). Both (A) and (B) are representative of three replicate experiments.
|
3
|
open_pmc_18m__00000002
|
|
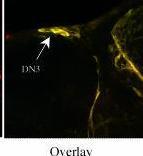
A PDF Peptide Binds to Many Cells, Including Several Clock Neuronal GroupsIn vitro biontinylated PDF peptide was used to visualize the peptide binding locations (middle panels, with Cy3) in the brain (see Materials and Methods for details). We used membrane-bound GFP (green panels on the left) to label specific circadian neurons as well as their projections (right panels show the overlay of both channels).(A) The brain is from flies with labeled LNvs (y w,UAS–mCD8iGFP;pdf–GAL4). Numerous cells at the periphery of the medulla have the vast majority of the bound PDF peptide signal within the brain. This region receives widespread dendritic arborizations from the l-LNvs.(B) Bound PDF peptide was also detected on the surface of LNvs at a lower intensity. LNv cell bodies were labeled using UAS–mCD8iGFP;pdf–GAL4. Since the signal from the Cy3 channel was much weaker than the GFP signal, we reduced the output gain from the GFP channel. Sequential scanning was used to prevent cross-talk between the two channels.(C) y w,UAS–mCD8iGFP;tim–GAL4/+ flies were used to label all circadian neurons. In the dorsal region shown in this series, the arrow points to a group of DN3 neurons.
|
4
|
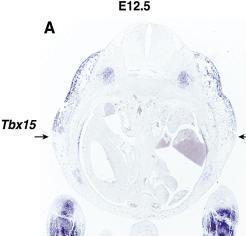
open_pmc_18m__00000003
|
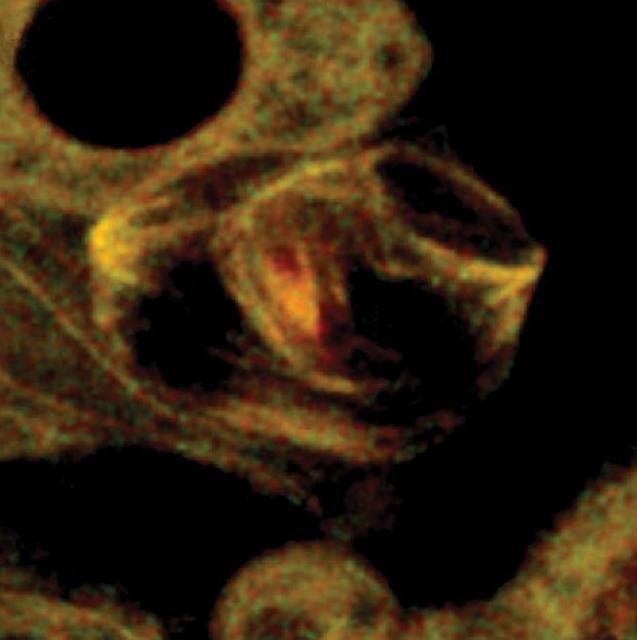
|
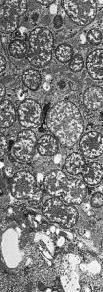
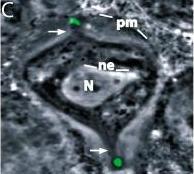
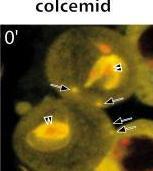
Electron micrograph of Proteobacteria in eukaryotic cell
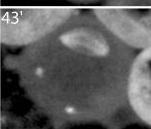
|
5
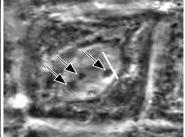
|
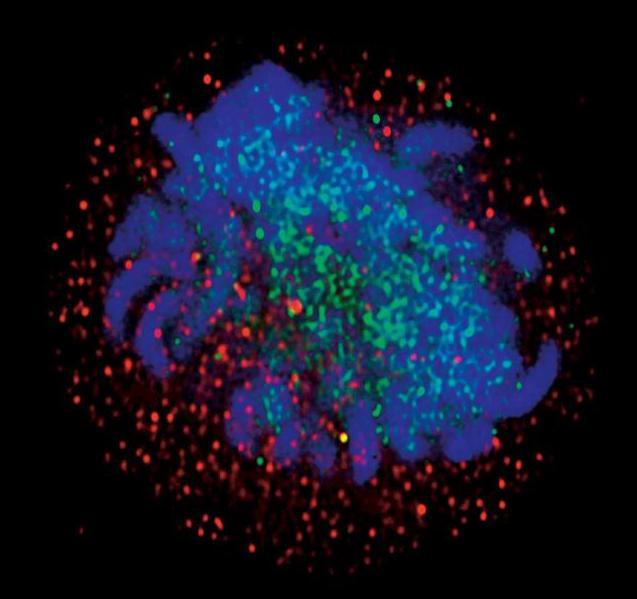
open_pmc_18m__00000004
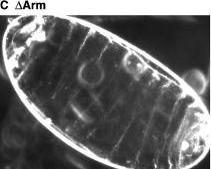
|
|
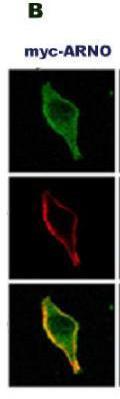
A. Real time image of the translocation of ARF1-GFP to the plasma membrane. HeLa cells that had been stably transfected with ARF1-GFP were transiently transfected with myc-ARNO, serum starved overnight, and treated with 100 nM insulin. Images were collected every 30 seconds using a Molecular Dynamics 2001 confocal microscope. The time intervals that were indicated on the upper right hand corner of each panel represent the time after the addition of insulin. B. The translocation of ARF1-GFP to the plasma membrane by the effects of insulin requires ARNO. ARF1-GFP/HeLa cells were transfected with myc-ARNO, treated, fixed, and stained for myc-epitope as described in the Materials and Methods section. Images displaying ARF1-GFP (green) and myc-ARNO (red) were merged us ing Adobe Photoshop software.
|
6
|
open_pmc_18m__00000005
|
|
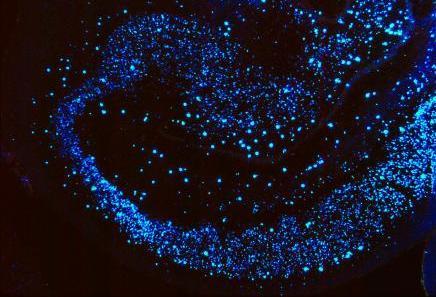
A Constellation of NeuronsImage courtesy of Miles Herkenham.
|
7
|
open_pmc_18m__00000006
|
|
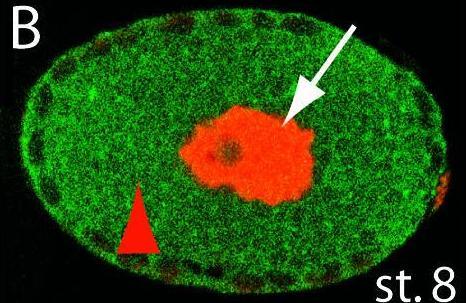
Expression of Dll in Bacteriocytes and the Pattern of Bacteriocyte Development Are Conserved in Parthenogenetic Females of P. spyrothecae
Confocal micrographs of P. spyrothecae parthenogenetic embryos stained with anti-Dll antibody (red).(A) Dll is first detected in stage 6 embryos in one or two nuclei posterior to the cellular blastoderm (arrow).(B) By stage 8, the bacteria have been transferred to and entirely fill the embryo (red arrowhead). The Dll-expressing nuclei (arrow) have become highly polyploid.(C and D) At stage 12, only the original bacteriocyte nuclei are observed expressing Dll (white arrow), but by stage 14 (D) additional nuclei (blue arrow) closely apposed to the dorsal germband express Dll.(E) By stage 15, these new nuclei surround the original bacteriocyte, and at later stages the bacteria are divided into individual cells.
|
8
|
open_pmc_18m__00000007
|
|
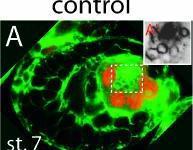
Elimination of B. aphidicola by Treatment with Antibiotics Has No Effect on the Determination and Maintenance of the Bacteriocyte Cell Fate in A. pisum
(A–C) Confocal micrographs of control embryos stained with anti-Dll antibody (red) show expression of Dll, as described in Figure 1. Enlarged views of the bacteria within the broken white boxes in each embryo are shown in (A′)–(C′).(D–F) Embryos within aposymbiotic aphids at comparable stages as the controls in (A)–(C) express Dll in bacteriocyte nuclei. No bacteria are observed within these embryos, as seen in the enlarged views of (D′)–(F′).
|
9
|
open_pmc_18m__00000008
|
|
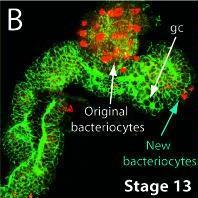
The Second Wave of Bacteriocyte DeterminationIn (A)–(D), the embryos, which are normally folded in upon themselves in a pretzel shape within the ovariole (Miura et al. 2003), have been dissected flat, stained with anti-Dll antibody (red) and phalloidin (green), and examined with a confocal microscope.(A) Dll expression (red) in a stage 14 embryo is detected in the labrum (La) and all developing limbs on the ventral surface except the mandibular segment (Mn). (Other abbreviations: An, antenna; Mx, maxilla; Lb, labium; T1, T2, T3, first, second, and third thoracic leg, respectively.) The dorsal surface of the abdomen of the same embryo is shown illustrating Dll expression in the original bacteriocytes (white arrow) and in a more posterior population of nuclei or cells (blue arrow). Germ cells (gc) are labeled.(B) Dll expression is first observed in the new bacteriocyte nuclei at stage 13.(C) By stage 15, many of the new bacteriocytes have migrated to and begun intercalating between the original bacteriocytes.(D) By stage 16, all of the new bacteriocytes have intercalated between the original bacteriocytes.(E) The migration of the new bacteriocytes is seen in a confocal section of an undissected stage 14 embryo.Embryos in (A)–(D) are oriented with the anterior of the germband towards the left.
|
10
|
open_pmc_18m__00000009
|
|
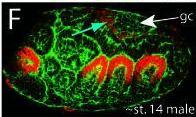
Bacteriocytes Are Retained in One Species That Has Evolutionarily Lost Bacteria, but Not in Males of Another Species That Do Not Inherit Bacteria(A and B) Confocal micrographs of embryos of T. styraci stained with anti-Dll antibody (red). In T. styraci, in which B. aphidicola has been evolutionarily lost (Fukatsu and Ishikawa 1992a), embryos still contain nuclei that express Dll in the correct time and place to be bacteriocyte nuclei. (A) Dll expression is first detected in posterior nuclei at blastoderm at approximately stage 6 (arrow). (B) By stage 14, the original nuclei have divided once or twice and become polyploid (original bacteriocytes), and new cells begin to express Dll (new bacteriocytes; blue arrow) and migrate towards the original bacteriocytes.(C–F) Confocal micrographs of embryos of P. spyrothecae stained with anti-Dll antibody (red). (C) Stage 16 male embryos of P. spyrothecae do not contain B. aphidicola, and no Dll-expressing cells are observed in the expected location for bacteriocytes. We believe that the cells in this location are sperm (marked with an asterisk). Sexual female embryos within the same ovary do contain Dll-expressing original and new bacteriocyte nuclei (white and blue arrows, respectively). (D and E) Transient expression of Dll in putative bacteriocytes is observed in stage 7 male embryos (arrow in male embryo of [D]), but this expression does not persist into stage 10 male embryos (E), where no Dll-expressing nuclei are observed. By contrast, stage 6 female embryos (D) contain polyploid Dll-expressing nuclei (arrow in female embryo of [D]). The sex of each embryo could be determined because males develop synchronously and earlier than females (Lampel 1958, 1968). (F) In stage 14 male embryos, we observe transient Dll expression in nuclei (blue arrow) adjacent to the germ cells (gc) in the correct location to be the second wave of bacteriocyte nuclei. This Dll expression does not persist (see stage 16 male in [C]), and the fate of the cells is unknown.
|
11
|
open_pmc_18m__00000010
|
|
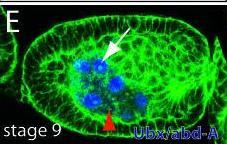
Expression of Three Transcription Factors during Early Bacteriocyte Development(A) Drawings of some stages of pea aphid embryonic development, approximately to scale. Embryos develop viviparously within a follicular epithelium of the ovariole (data not shown). For a complete description, see Miura et al. (2003). Bacteria are transferred at stage 7. Embryos are labeled with bacteria (b), head (h), thoracic (t), and abdominal (a) regions. The three thoracic segments (t1, t2, t2) and germ cells (gc) are indicated in the stage 14 embryo.(B) A drawing of a stage 7 embryo illustrates transovarial transfer of the bacteria (red arrowhead) to the embryo and the presumptive bacteriocyte nuclei (arrow).(C) Confocal micrograph of a stage 6 embryo stained with anti-Dll antibody (red, indicated by arrow). Anti-Dll labels syncytial nuclei (presumptive bacteriocyte nuclei) in the posterior of the embryo.(D) Confocal micrograph of stage 7 embryo stained with anti-Dll and FP6.87 antibodies. Soon after the bacteria begin to invade the embryo, we observe staining with the FP6.87 antibody localized to the nucleoli (blue), which recognizes both Ubx and Abd-A in diverse arthropods, in the same nuclei that are already expressing Dll (red). The region outlined with a broken white box is enlarged in (D′) to show the bacteria, and only the green channel is shown in monochrome. The red arrow indicates one bacterium.(E and F) In these two panels of the same focal plane from the same stage 9 embryo, Ubx/Abd-A staining (blue) is observed throughout the entire nucleus of all nuclei that also express Dll (red).(G) Confocal micrograph of a stage 8 embryo stained with anti-En (yellow). As the transfer of bacteria (arrowhead) is being completed, the bacteriocyte nuclei begin to express En (yellow, indicated with arrow).In (C)–(G), confocal micrographs show only one focal plane of the embryo, so not all bacteriocyte nuclei in each embryo can be seen. In all figures, F-actin is stained with phalloidin (green). Embryos in all figures, except Figure 2, are oriented with anterior of the entire embryo (towards the germarium) to the left.
|
12
|
open_pmc_18m__00000011
|
|
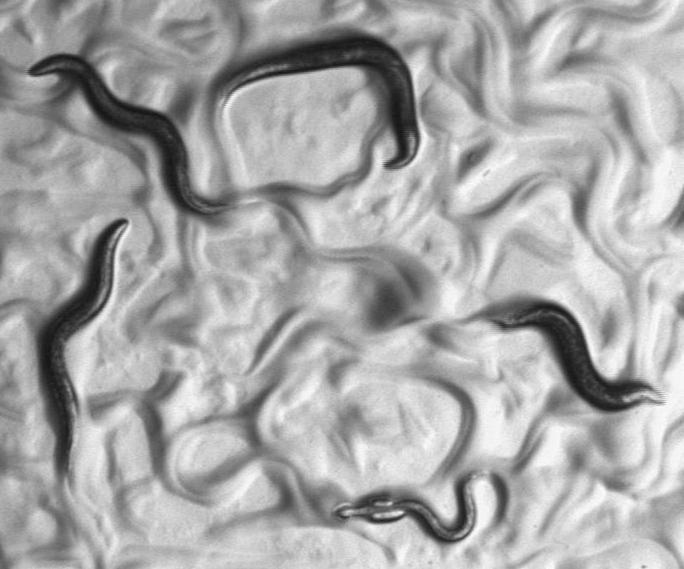
Caenorhabditis elegans worms
|
13
|
open_pmc_18m__00000012
|
|
ARK and DRONC Are Required for Spermatid Individualization(A and C) Testis from β2tub-Ark-RNAi and β2tub-Dn-DRONC males, respectively. Active DRICE-positive cysts are present, but cystic bulges and waste bags are largely absent.(B and D) Investment cone movements in testis from β2tub-Ark-RNAi and β2tub-Dn-DRONC, respectively, are uncoordinated.(E, G, and H) EM images of an elongated cyst from a β2tub-Ark-RNAi male. Some individualization failures are observed (E, G, and H), two of which are highlighted by the dashed lines in (G) and (H). In addition, many spermatids that have apparently undergone individualization still contain large amounts of excess cytoplasm (E and G).(F) EM image of a cyst from a β2ub-Dn-DRONC male. A large region in which individualization did not occur is outlined.(I) Western blot from wild-type (Wt) and β2tub-Ark-RNAi (DArki) testis probed with anti-ARK and anti-DRICE antibodies. ARK, but not DRICE, levels are greatly reduced in β2tub-Ark-RNAi testis.
|
14
|
open_pmc_18m__00000013
|
|
The bln1 P-Element Insertion, Which Inhibits Cyt-c-d Expression, Results in Pleiotropic Defects in Spermatogenesis(A) Genomic organization of the cyt-c-d region. Upper half of the panel illustrates the structure of the region, as described by Arama et al. (2003). The lower half of the panel indicates the relative locations of several other genes in the region, as annotated by the Berkeley Drosophila Genome Project (http://flybase.bio.indiana.edu/search/) as of August 2002. The bln1 P element is inserted within the cyt-c-d transcription unit. This P element is also inserted within the transcription unit of a second gene, CR31808-RA (RE70695). Both of these genes and the bln1 P element reside within the intron of a third gene, CG31782.(B and D) Wild-type and bln1 testis, respectively, stained with anti-active DRICE antibodies. Active DRICE immunoreactivity is eliminated in bln1 testis, as described in Arama et al. (2003).(C and E) Wild-type and bln1 testis, respectively, stained with AXO49 antibodies (blue), which recognize polyglycylated β2tub present in axonemal microtubules, and phalloidin (red). Polyglycylation occurs prior to individualization (Bressac et al. 1995). Axonemes of elongated cysts from wild-type flies stain with AXO49 (C), while those from bln1 males do not (E).(F–I) EMs of cysts of different developmental stages from wild-type (F and G) and bln1 (H) testis. (F) Wild-type cyst prior to individualization. Note the structures of the major and minor mitochondrial derivatives, in particular the fact that the major mitochondrial derivative is increased in size and is electron dense. (G) Wild-type cyst following individualization. (H) Representative example of the most mature cysts found in bln1 testis. Note the dramatically increased cell size and the lack of differentiation of the major and mitochondrial derivatives, as compared to wild-type.
|
15
|
open_pmc_18m__00000014
|
|
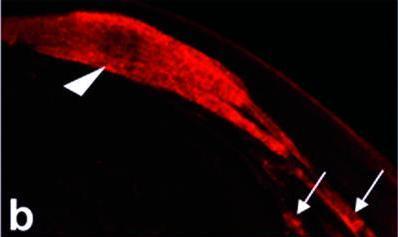
HID, dFADD, and DREDD Participate in Individualization(A) HID protein (green) is concentrated in the region of the cystic bulge, which is marked by the presence of the phalloidin-stained individualization complex (red).(B) HID immunoreactivity is absent in testis from hid 05014/H99 flies.(C) Active DRONC (green) is associated with the trailing edge of the individualization complex in a wild-type cyst.(D) Active DRONC is absent from the individualization complex in cysts from hid 05014/H99 males.(E) EM section from hid 05014/H99 testis. Essentially all spermatids have failed to individualize.(F) Higher magnification view of boxed area in (E). Multiple spermatid units sharing a common cytoplasm are outlined by the dashed line.(G) Representative EM section of cyst from dFadd f02804/dFadd f02804 testis. Essentially all spermatids have failed to individualize.(H) EM section of cyst from Dredd B118/Dredd B118 testis in which individualization has failed to occur. In some other cysts from this same male, individualization proceeded apparently normally (data not shown).
|
16
|
open_pmc_18m__00000015
|
|
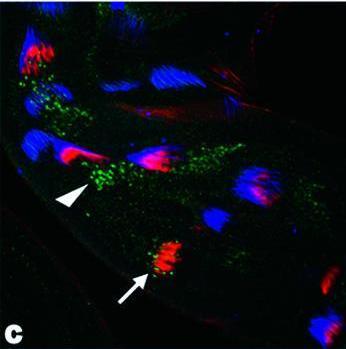
DRONC Activation Occurs in Association with Individualization Complexes and Is ARK-Dependent(A and B) Wild-type testis stained for active DRICE (green), phalloidin-stained filamentous actin (red), and TOTO-3-stained DNA (blue). (A) Active DRICE is present throughout the length of cysts undergoing individualization. (B) Higher magnification of the testis in (A). The arrowhead points to a cyst in which the individualization complex has assembled around the spermatid nuclei, but DRICE activation has not occurred. The arrow points to a neighboring cyst in which the individualization complex has just begun to move away from the spermatid nuclei. Active DRICE is now present throughout the length of this cyst, indicating that DRICE activation within a cyst occurs rapidly and globally.(C) Active DRONC (green) is initially present in a punctate pattern, apical to the individualization complex (red) at the base of the testis (arrowheads). The individualization complex then moves through the region containing active DRONC (arrow).(D) Subsequently, active DRONC is found associated with the trailing edge of the individualization complex as it moves apical within the cyst. A higher magnification view of active DRONC staining in the left-most cyst is shown in the inset.(E and F) Active DRONC is eliminated in cysts from β2tub-Ark-RNAi and β2tub-Dn-DRONC testis, respectively.
|
17
|
open_pmc_18m__00000016
|
|
Active DRICE Is Eliminated from the Cytoplasm of Wild-Type Spermatids Following Passage of the Individualization Complex, but Not from Spermatids in Which Caspase Activity Has Been Inhibited(A) Cystic bulge from a wild-type cyst stained with active DRICE (red). The cystic bulge (arrowhead) is moving to the left. Active DRICE staining is absent in areas of the spermatid bundle that the individualization complex has passed through and in which excess cytoplasm has been eliminated (arrow).(B) Cystic bulge from a β2tub-p35 cyst. The cystic bulge (arrowhead) is decreased in size, and active DRICE is present in areas of the spermatid bundle through which the individualization complex has moved (arrows). These observations suggest caspase inhibition results in at least a partial failure to eliminate excess cytoplasm, but that this is not necessarily associated with lack of movement of the individualization complex.
|
18
|
open_pmc_18m__00000017
|
|
driceless Males Lack Active Drice Staining and Show Defects in Individualization(A) Testis from driceless male stained with active DRICE. Active DRICE staining is eliminated.(B) Elongated cysts from driceless male. AXO49 staining (blue) outlines the location of three cystic bulges. Individualization complexes (arrows) are marked with phalloidin (red).(C) Example of a cyst from a driceless male in which individualization has proceeded normally.(D) Example of a cyst from a driceless male in which individualization has failed to occur.(E) Boxed area in (D) shown at higher magnification. A region in which individualization has failed is outlined with a dashed line.
|
19
|
open_pmc_18m__00000018
|
|
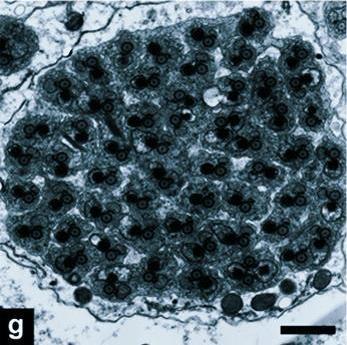
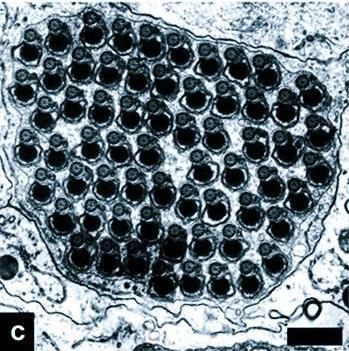
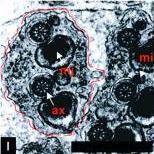
Caspase Activity Is Required for Spermatid Individualization(A–C) Testis of different genotypes were visualized with antibodies specific for activated Drice (green). (A) Wild-type testis. Active DRICE is present in multiple elongated cysts. Cystic bulges (cb) and waste bags (wb) are indicated by arrows. (B and C) Testes from β2tub-DIAP1 and β2tub-p35 males, respectively. Active DRICE is present in elongated cysts, but cystic bulges and waste bags are reduced in number and size.(D–F) Phalloidin-stained investment cones from testes of different genotypes (red). Spermatid axonemes in (D)–(F) are highlighted by the AXO49 antibody, which recognizes polyglycylated β2tub (Bressac et al. 1995) (blue). (D) In wild-type testes, investment cones move as a coordinated group. (E and F) Coordinated investment cone movement is disrupted in cysts from β2tub-DIAP1 and β2tub-p35 males, respectively.(G–L) EM sections of elongated cysts of different genotypes. (G) A cyst from a wild-type male that has undergone individualization. The boxed region is shown at higher magnification in (J), along with the locations of the major mitochondrial derivative (mj), minor mitochondrial derivative (mi), and axoneme (ax). A single spermatid unit is outlined with a dashed line. (H and I) In cysts from β2tub-DIAP1 and β2tub-p35 males, respectively, many spermatid units are present in a common cytoplasm that contains organelles, often including an enlarged minor mitochondrial derivative. Boxed regions of β2tub-DIAP1 and β2tub-p35 cysts shown in (H) and (I) are shown at higher magnification in (K) and (L), respectively. Several examples of multiple spermatids present in a common cytoplasm are outlined by the dashed line in (K) and (L). Scale bar for EM micrographs = 1 μm.
|
20
|
open_pmc_18m__00000019
|
|
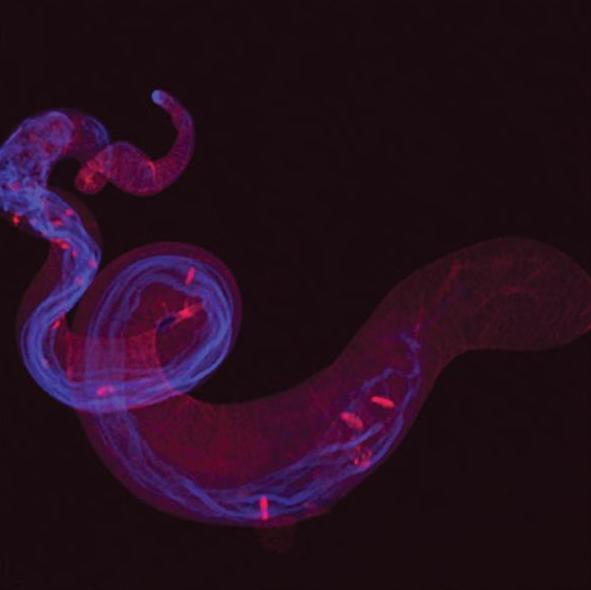
Developing spermatids in a normal Drosophila testis
|
21
|
open_pmc_18m__00000020
|
|
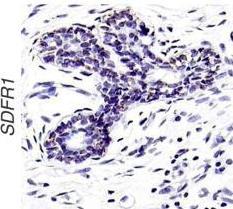
Histological Architecture of CSR Gene Expression in Breast CancerRepresentative ISH of LOXL2 and SDFR1 and IHC of PLOD2, PLAUR, and ESDN are shown (magnification, 200×). Panels for LOXL2, PLAUR, PLOD2, and ESDN represent cores of normal and invasive ductal breast carcinoma from different patients on the same tissue microarray. Panels for SDFR1 demonstrate staining in adjacent normal and carcinoma cells on the same tissue section. Arrows highlight spindle-shaped stromal cells that stain positive for SDFR1 and PLOD2. No signal was detected for the sense probe for ISH or for control IHC without the primary antibody.
|
22
|
open_pmc_18m__00000021
|
|
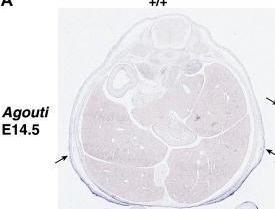
Effect of deH on Agouti ExpressionComparable sections from at/at; deH/deH and at/at; +/+ littermates.(A) At E14.5, deH/deH embryos have a smaller body cavity and loose skin within which Agouti expression appears to be shifted dorsally, as marked by arrows (scale bars = 500 μm).(B) At P4.5, Agouti expression in both dorsal and ventral skin is similar in deH/deH compared to nonmutant, but in the midflank region, there is increased Agouti expression in deH/deH, especially in the upper dermis (scale bars = 200 μm). Sections shown are representative of two mutant and two nonmutant samples examined at each time.
|
23
|
open_pmc_18m__00000022
|
|
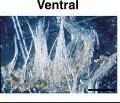
Embryonic Establishment of Dorsoventral Skin PatterningPieces of skin from dorsal, flank, and ventral regions of at/a E12.5 embryos were transplanted into the testes of congenic animals as described in the text. Hair color of the grafts was examined 3 wk later. Grafts of ventral embryonic skin (n = 3) produced yellow hairs, dorsal embryonic skin (n = 4) produced black hairs, and flank embryonic skin produced mostly (13 out of 15) black and yellow hairs in distinct regions as shown. In parallel, in situ hybridization studies revealed that the embryonic flank contains the boundary of expression between Agouti and Tbx15 (scale bars = 1 mm for hairs and 200 μm for in situ hybridization results).
|
24
|
open_pmc_18m__00000023
|
|
Developmental Expression of Tbx15
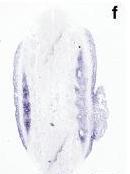
(A) At E12.5, transverse sections at different levels show expression in head mesenchyme (a and b); myotome, occipital, and periocular mesenchyme (b); palatal shelf, cervical sclerotome, and nasal cartilage (c); maxillary and mandibular processes (d); limbs (e); and myotome and lateral mesenchyme (e and f) (scale bars = 500 μm).(B) Transverse sections through the flank at different times show expression in lateral mesenchyme (E11.5), expanding dorsally at E12.5, and both ventrally and dorsally at E13.5, detectable in loose mesenchyme underlying the dermis and the abdominal and subcutaneous muscles (scale bar = 500 μm). At P3.5, Tbx15 is expressed in the entire dermis and is most strongly expressed in dermal sheaths (scale bar = 200 μm).
|
25
|
open_pmc_18m__00000024
|
|
Embryonic Expression of Tbx15 Compared to Agouti in at/at Mice(A and C) Tbx15. (B and D) Agouti. At E12.5, expression of Tbx15 in dorsal skin is approximately complementary to that of Agouti in ventral skin. At E14.5, the levels of expression for both genes are lower, but Tbx15 expression has expanded ventrally and overlaps extensively with that of Agouti. In all four panels, arrows mark the approximate ventral limit of Tbx15 and the approximate dorsal limit of Agouti (scale bars = 500 μm).
|
26
|
open_pmc_18m__00000025
|
|
Centrosome-independent spindle assembly
|
27
|
open_pmc_18m__00000026
|
|
Centriole Migration in Primary Spermatocytes(A) Time-lapse series of confocal images from a wild-type primary spermatocyte expressing GFP-PACT (centrioles) and His2AvD–GFP (chromosomes). The centrioles (arrows) can be seen moving away from the plasma membrane (0) towards the nucleus (N) and then migrating diametrically apart as the chromatin condenses. The chromosomes are fully condensed at timepoint 121 min.(B–D) The two centriole pairs (green) projected over the phase-contrast view (grey) can be seen close to the fenestrated NE and away from the plasma membrane (pm) in control cells (B), while they remain plasma membrane-bound in asp (C) and in colcemid-treated wild-type cells (D). In asp spermatocytes (C), the position of the membrane-bound centrioles correlates tightly with the pointed end of phase-dark protrusions (arrows) that are not present in colcemid-treated cells. These reflect the distribution of phase-contrast membranes known to overlap microtubules in these cells.(E–J) XY projections (E–G) and their corresponding optical sections (H–J) of control (E and H), asp (F and I), colcemid-treated spermatocytes (G and J) expressing an endogenous GFP–α-tubulin confirm that the two major MTOCs in control cells are close to the nucleus, but remain near the plasma membrane in the two experimental conditions. MTOC activity in colcemid-treated spermatocytes was assayed following a 1-s pulse of 350 nm light to inactivate the drug, thus allowing microtubule regrowth. The yellow bar in the XY projections (E–G) marks the position of the corresponding XZ optical sections (H–J).
|
28
|
open_pmc_18m__00000027
|
|
Time-Lapse Series of Meiosis Progression in Control, asp, and Colcemid-Treated SpermatocytesTimepoint 0 coincides with the time of NEB revealed by the sudden entry of GFP signal into the nucleus. In control cells (Video 2), microtubules are mainly organised around the centrosomes (arrows). However, when centrosomes are kept away from the nuclear region by mutation in asp (Video 3) or colcemid treatment (Video 4), microtubule nucleation and growth are clearly revealed over the nuclear region (N), well away from the centrosomes. Such noncentrosomal microtubules may form bundles that eventually are sorted into spindlelike bipolar microtubule arrays. Microtubules were labelled with an endogenous GFP–α-tubulin fusion.
|
29
|
open_pmc_18m__00000028
|
|
Chromosome Segregation in Anastral Spindles in Drosophila Spermatocytes(Control [Video 5]) At metaphase I (0), the bivalents (revealed by a His2Avd–YFP fusion, shown by double arrowheads) are aligned in the middle of the spindle (revealed by a GFP–α-tubulin fusion), at the metaphase plate. At the onset of anaphase (3 min), the homologue chromosomes start to migrate towards opposite poles (single arrowheads) and to decondense. During anaphase B (4 min and 6 min), the spindle poles move apart from each other and the two sets of decondensed chromosomes become further separated.(asp [Video 6]) At timepoint 0, the bivalents align at the metaphase plate. Homologue chromosomes split apart at the onset of anaphase I (4 min). However, anaphase A migration is highly impaired. By the time the chromosomes start to decondense, they have barely moved towards the spindle poles (8 min and 14 min), and often homologue chromosomes end up included in the same daughter nucleus.(Colcemid [Video 8]) As in asp spermatocytes, the asters (arrows) remain at the plasma membrane at metaphase I in colcemid-treated cells, and the bivalents align in a metaphase plate-like within the acentrosomal spindles (0 min). Homologue chromosomes split apart at the onset of anaphase (upper cell, 6 min) and significantly segregate from one another (upper cell, 8 min; lower cell, 3 min). Further separation of the daughter nuclei during anaphase B is very limited in these cells (8 min), and cytokinesis does not occur.
|
30
|
open_pmc_18m__00000029
|
|
The Place of Noncentrosomal Microtubule NucleationThe initial stages of noncentrosomal microtubule nucleation revealed by an endogenous GFP–α-tubulin fusion (left) and phase contrast (right). Following the corresponding videos, it is possible to unmistakably tell the chromosomes (arrows) apart form the other phase-dark objects that are present over the nuclear region (asterisks). The cell in (A) is shown as a single timeframe and the cell in (B) as a time-lapse series. In both cells, noncentrosomal microtubule nucleation (arrowheads) takes place close to the remains on the NE and does not overlap with the major chromosomes. Nucleation sites can be clustered (A) or dispersed (B). In the time-lapse series (B), only the chromosomes that are in focus are labelled. Timepoint 0 min in these series corresponds to the first sign of noncentrosomal microtubule nucleation, around 11 min after NEB. A white bar marks the growing end of a microtubule bundle that at timepoint 93 min reaches one of the bivalents.
|
31
|
open_pmc_18m__00000030
|
|
SIRT-1 Deacetylase—the Human Enzyme That Promotes Cell Survival—in a Dividing Human CellThe enzyme is marked in red, and the image is superimposed on acetylated proteins (green) and condensed chromosomes (blue). (Image courtesy of David Sinclair.)
|
32
|
open_pmc_18m__00000031
|
|
Expression of ArmΔArm Leads to the Nuclear Localization of Endogenous ArmProtein(A) Wild-type Arm protein appears in stripes that correspond to cells responding to Wg signaling.(B) Expression of ArmΔArm in an armF1a background leads to the nuclear localization of endogenous Arm.(C and D) Dark-field images reveal that expression of both ArmΔArm and ArmS10 leads to similar naked cuticle phenotypes.(E) An anti-Arm Western blot showing a faster-migrating band, which correlates with endogenous Arm's being active, and a slower-migrating band, which correlates with Arm's being inactive.
|